
Steelray Project Analyzer boasts a variety of features and tools that you can use to ensure that your project is on the right track.
The help topics below will walk you through utilizing simple and advanced features of Steelray Project Analyzer.
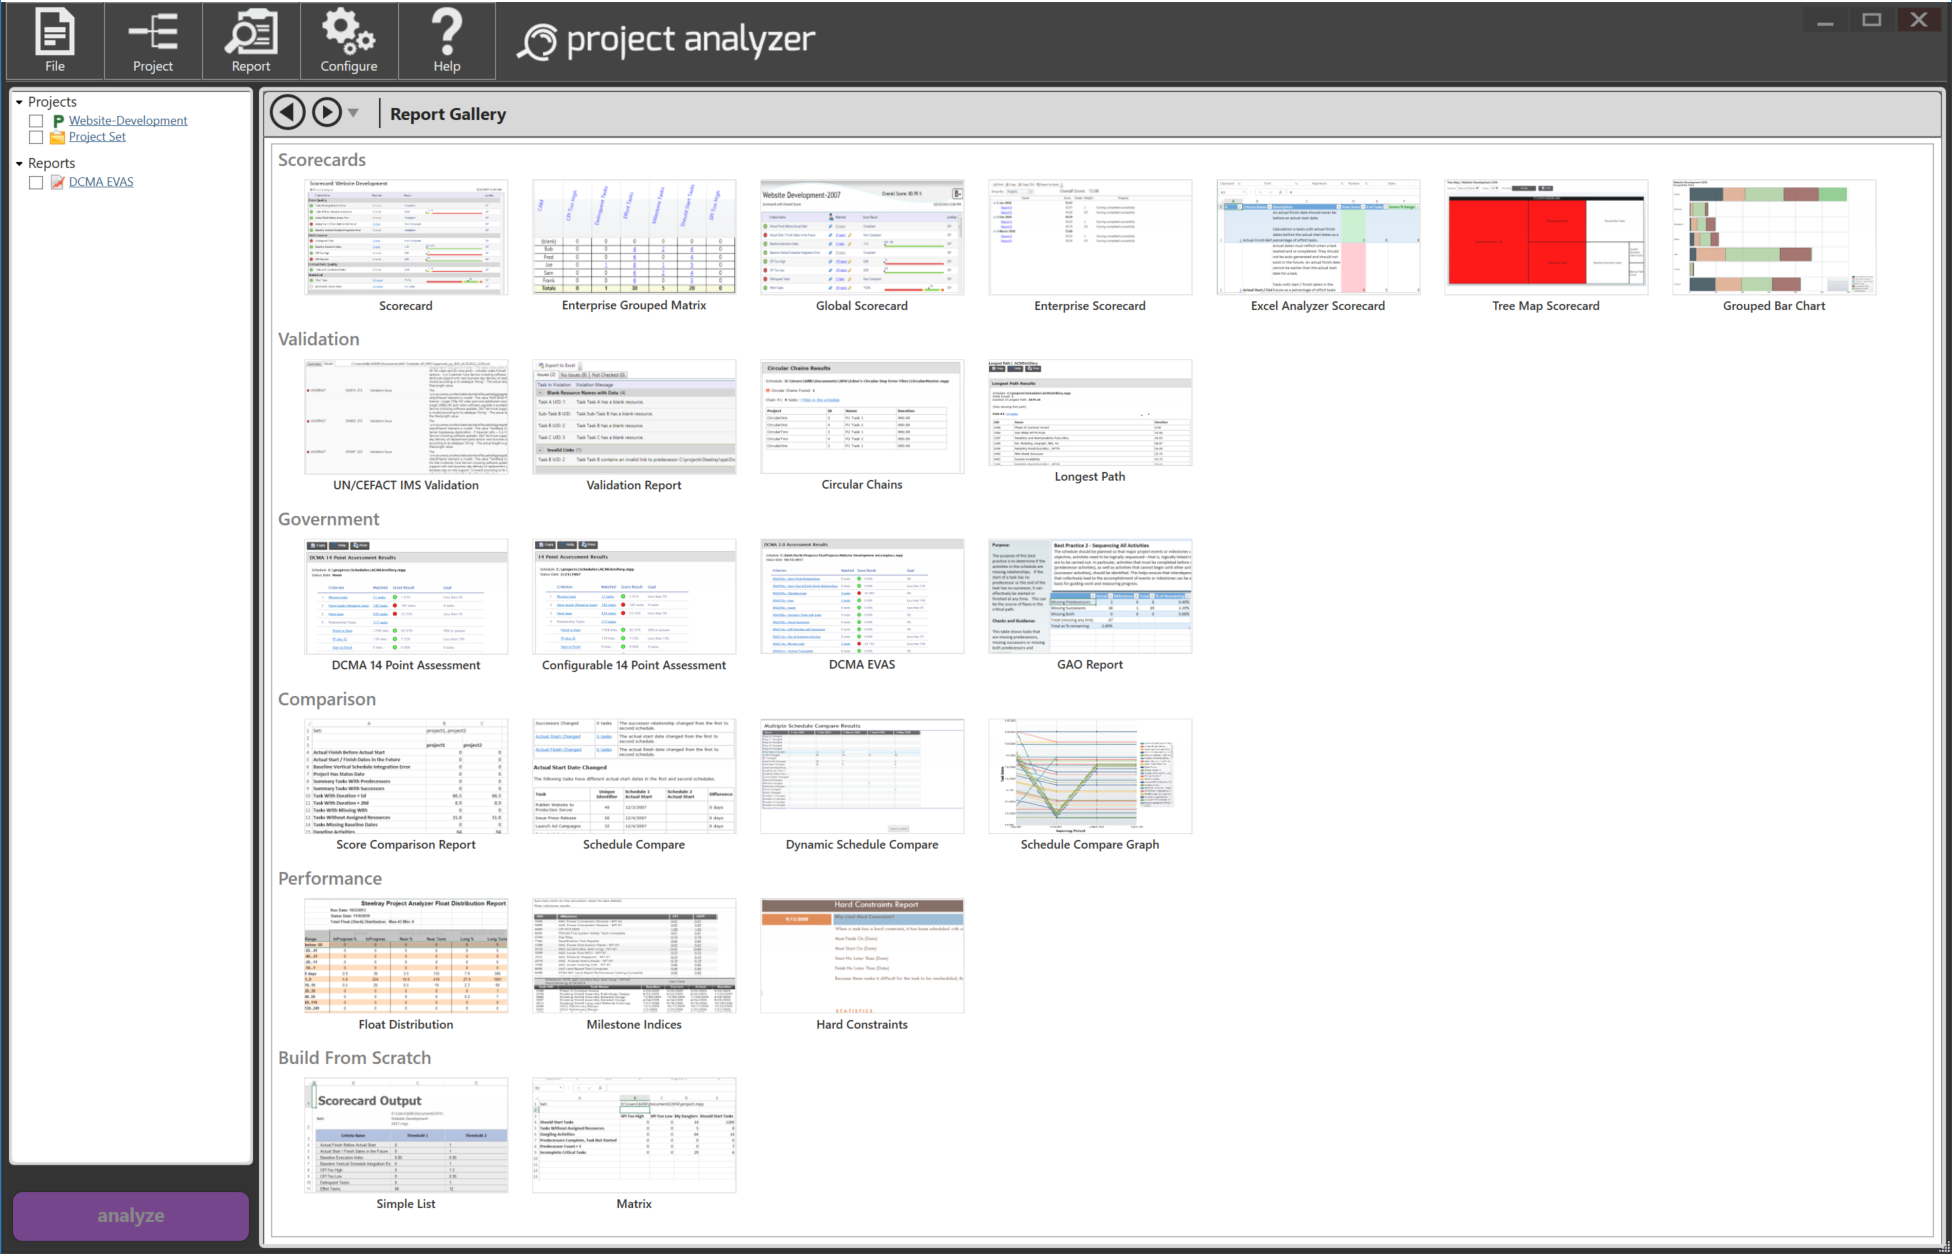
Steelray Project Analyzer starts up in the Report Gallery view. The Report Gallery view offers a report cookbook. Simply click on the report you'd like to create. Once the report is selected and configured (if necessary), pick a project and you're ready to analyze! For more information, please see the Gallery View topic.
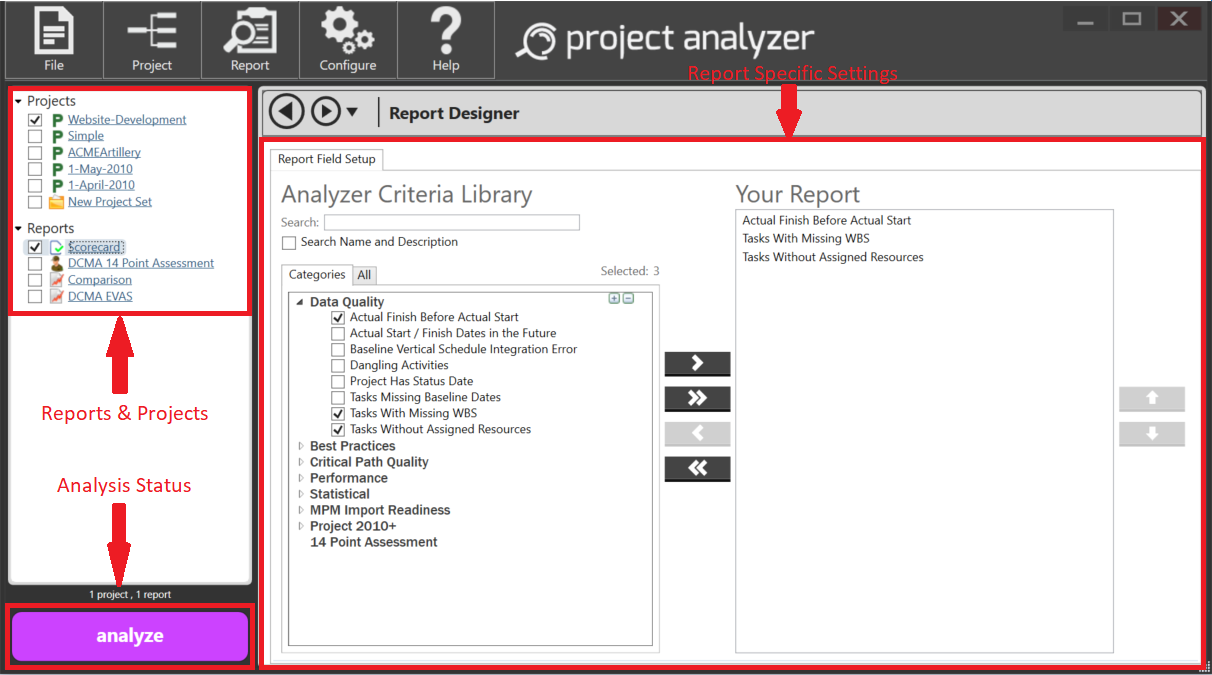
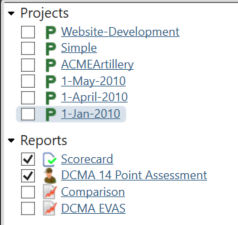
Steelray Project Analyzer has a navigation feel similar to Microsoft Outlook. A list of items and folders are built on the left hand side. Clicking on the items in the navigation pane displays the appropriate settings for the item in the right-hand pane. The list on the left is grouped into two categories. Projects and Reports. One item from each group is required to perform an analysis.
You can create and manage items in the list on the left using the right mouse button. For example, right clicking on Project file in the list would give properties and options for that specific file. The Analyze button in the bottom left section reports whether or not Steelray Project Analyzer can begin analyzing. In order to analyze your schedule, you must have at least one project and at least one report item added. When these items are checked in the list, the Analyze button is enabled:

When the Analyze button is clicked, the progress of the analysis is displayed in the right hand pane. Analysis can be cancelled at any time.
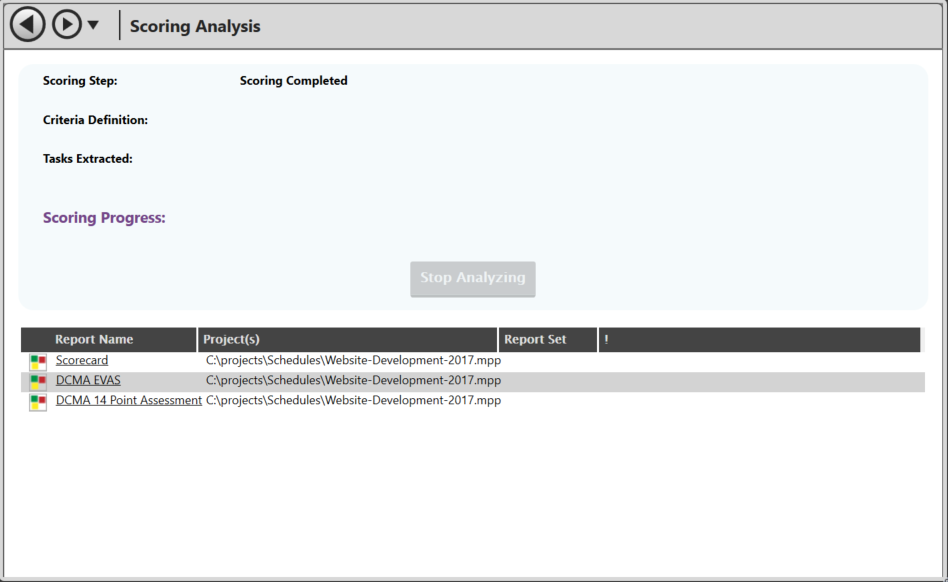
When scoring completes, the selected reports will be displayed in the Scoring Analysis section. Click any of the hyperlinked report names to display that particular report.
[contents]
When you downloaded Steelray Project Analyzer (SPA), you probably received an evaluation key. To continue running SPA after the trial period, you'll need to purchase and activate a permanent License Key. There are two types of License Keys: Trial and Subscription. Trial keys are valid for ten days after they are generated and allow all functionality; we do not disable any feature during a trial. Subscription keys are provided with purchased licenses and have an expiration date. Purchasing a subscription entitles you to updates free of charge during the lifetime of the subscription. You cannot run Analyzer without a valid, activated license key.
NOTE: You can visit our support site at any time by clicking the links in the help box at the bottom of the activation form or by clicking here.
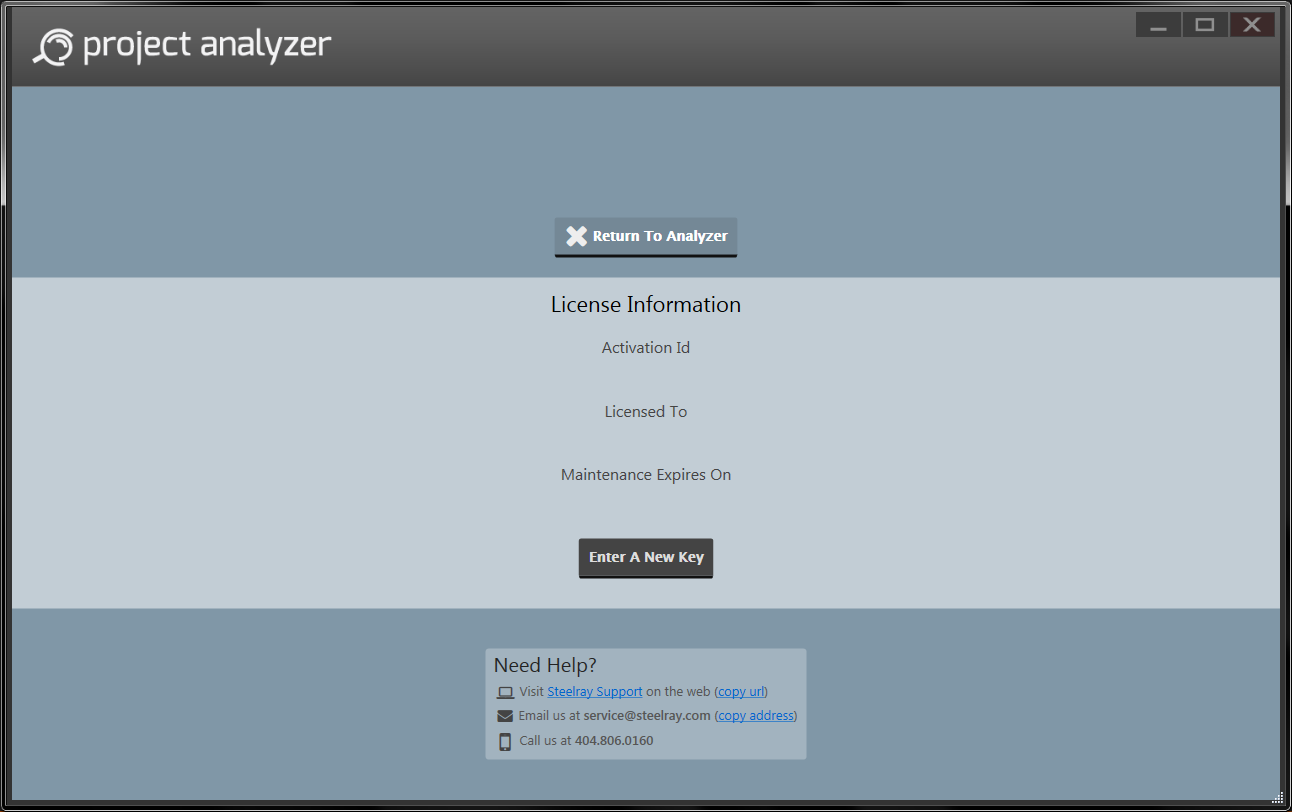
Above is the Manage License Key dialog. This is where your respective license information is displayed. You can find this by clicking on Help and selecting Manage License Key. In order to enter a new key or activation code, click 'Enter A New Key'.
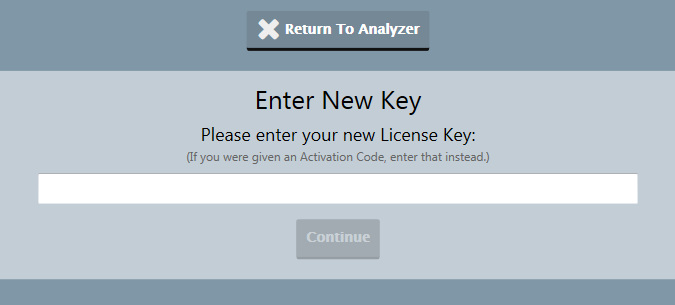
If you copied the the license key or activation code you received by e-mail, you can right-click and click Paste, and the key will be pasted into the dialog box. After clicking Continue, Viewer will check the validity of the key you entered. If this key is valid you will be asked to enter your name and email for licensing purposes.
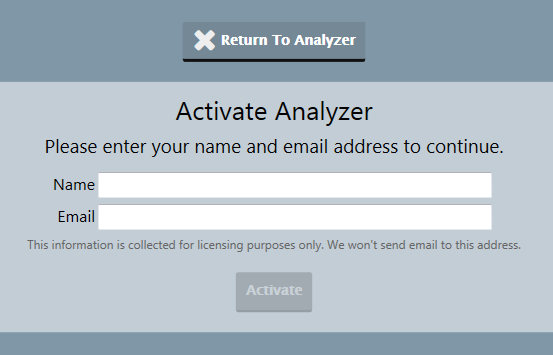
If you click Continue, SPA will contact the Steelray servers and activate your license key, once this is complete you will be running a fully activated license key. However, if there is an issue with your license key, or a connection error, you will be notified and prompted to re-enter your key or try activating manually.
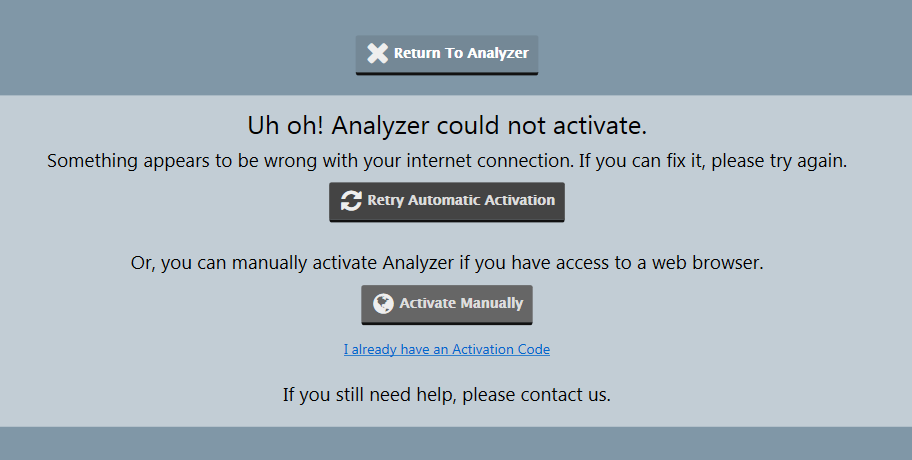
By clicking Activate Manually, you will be taken to our activation webpage, where you will be given an Activation Code upon entering the appropriate information. After entering this code, you'll need to verify your email to continue.
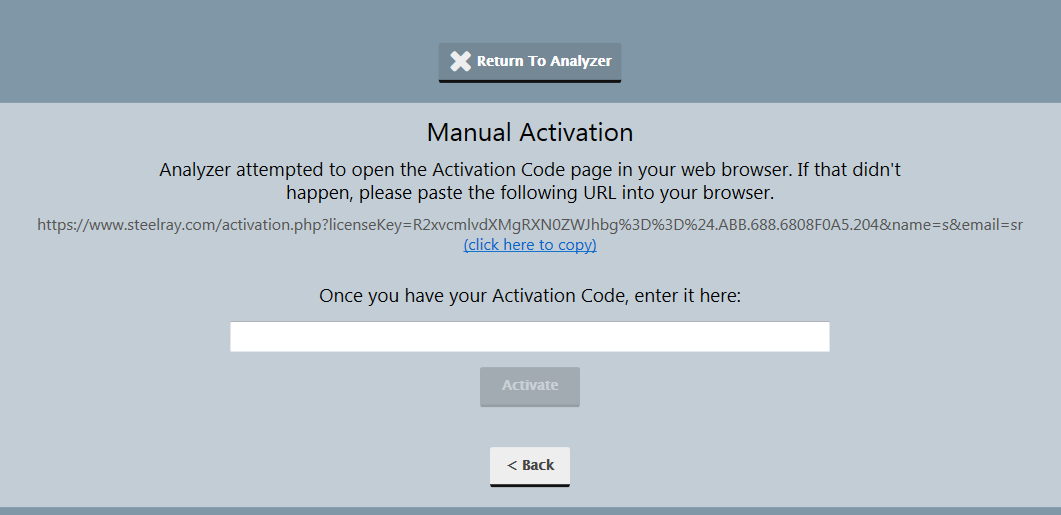
Click Continue and you should now have an activated license key.
[contents]
Items in the Project list can contain single Project files or multiple Project files that are represented as a Project Set.
Adding Single Project Files
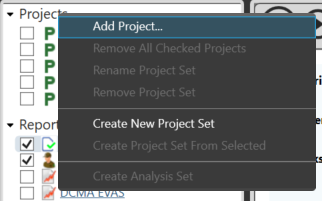
The simplest means of getting started is to add a single Project file. For the sake of a simple and quick demonstration, start by adding a single file. To do so, right-click on the Projects node of list and select Add Project... as shown below.
Select any Microsoft Project file on your computer and click OK.
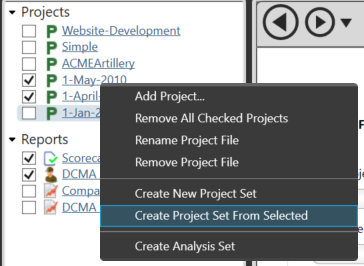
Project sets are simply a grouping of one or more Project files that are created on the same platform. A project set can contain Microsoft Project files, or Primavera XER files, but not both. This is particularly convenient if there is a logical collection of projects that need to be analyzed on a regular basis. If the Project files already exist within the Projects list, place a check mark by each item, right-click and select Create Project Set From Selected.
Alternatively, you can create a project set from scratch. To begin, right click on the Projects item in the list and select Create New Project Set. Once the Project Set is created, either right-click on the Project Set folder or click the Click here to add more link on the Project Set's Settings page to add a project file to the set.
The Project Settings page will allow you to customize project-specific settings that can be used when analyzing your schedule, depending on the report.
Project Sets
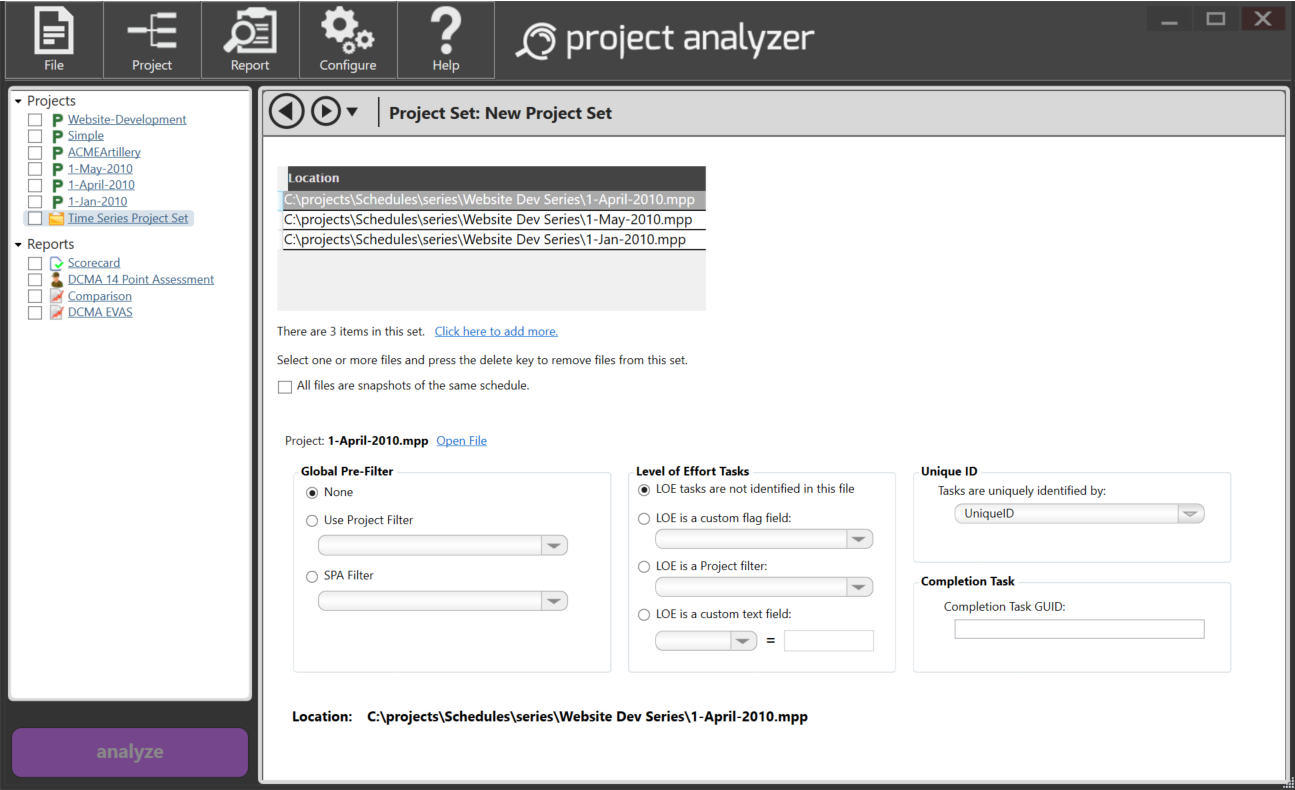
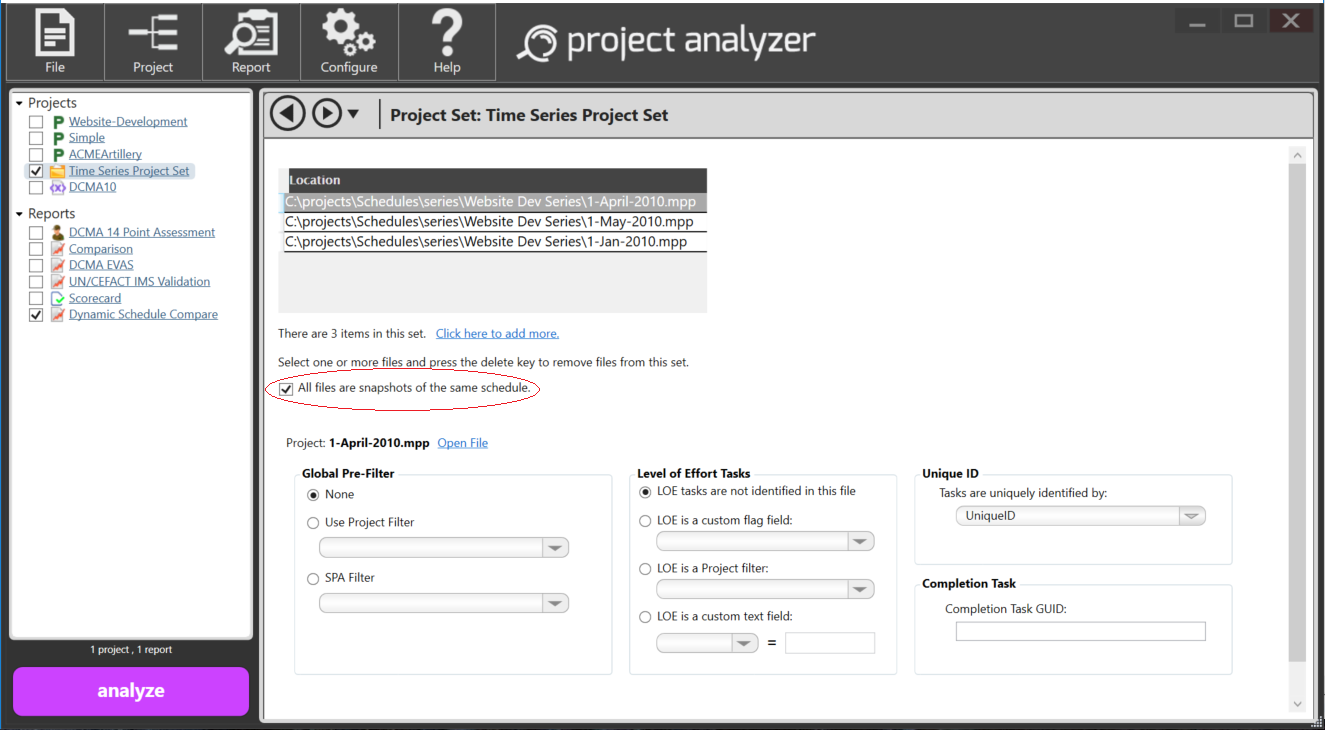
If a Project Set is selected in the Projects listing (shown in above image), the table at the top of the window will list each project that is part of the set. As different schedules are selected in the table, the details and settings displayed in the bottom portion of the page will update (see the next section for more details about the individual project settings). There are two ways to add projects:
A set of snapshots, or previous copies of a schedule, are used in the 06A504a and 06A504b metrics in the DECM report, as well as with the Dynamic Schedule Compare report. To indicate that a project set contains snapshots, select the checkbox All files are snapshots of the same schedule.
If a single Project is selected in the Projects listing (shown in below image), the project listing table will not display, but the rest of the project settings are displayed for the selected project.
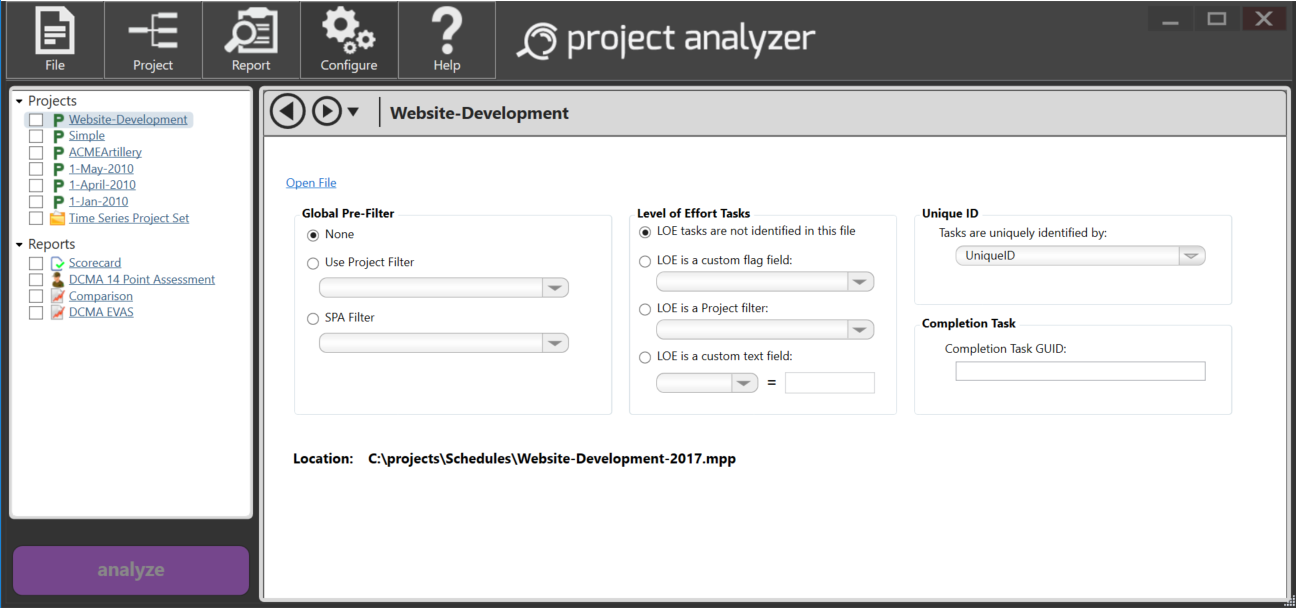
Global Pre-Filter settings can be used to perform analysis on a subset of your schedule's tasks. See the Using Pre-Filters section below for more details on how to use this feature.
The Level of Effort (LOE) Tasks settings indicate how LOE tasks are identified in the schedule. If identified, LOE tasks are excluded from some criteria when a schedule is analyzed. The dropdown list for custom flag fields will allow the user to select a true/false (yes/no) field from the schedule. If a task has this field set to true or yes, it will be considered a LOE task. If the schedule is a Microsoft Project file, the Project filter list will allow the user to select a filter from the schedule which will include LOE tasks. The custom text field option will allow the user to select a text field from the schedule and indicate the value for that field which will indicate a task is identified as LOE.
The Unique ID selection is used by the Schedule Compare, the Dynamic Schedule Compare, and the Schedule Compare Graph reports. These reports show the difference between two project files, and they use the field that is designated as the Unique ID to decide which tasks to compare.
The Completion Task GUID is used to identify a schedule's final task when calculating critical path metrics for DCMA reports. It is also used to identify a project's completion task for the Longest Path report. Enter the value for the task's GUID field. If the GUID is not found when running the DCMA reports, the metrics requiring a completion task will fail to run. In the case of the Longest Path report, if the GUID is not found, the report will use the project's end date.
[contents]
To ensure a smooth analysis, it is recommended that you open the IMS in Microsoft Project first before beginning the analysis. This ensures that all prompts and possible errors from Microsoft Project are cleared.
[contents]
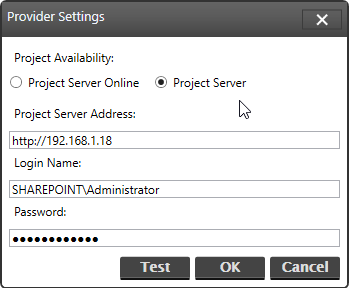
When using Project Server/Online (2013+) there are two availability options to select from. The first being Project Online where the login name will be the users Microsoft Id. The second being Project Server, for locally hosted solutions. The username for Project Server will be the user account associated with the Sharepoint login formated as DOMAIN\USERNAME.
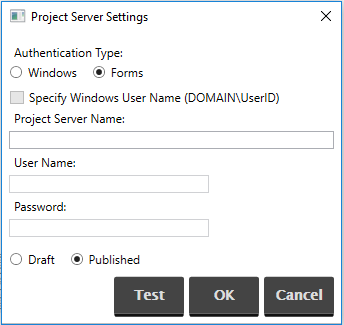
When using Project Server (2010 or Older) there are three types of authentication. The first two authentication types are Windows authentication and Forms authentication. In most environments, Windows authentication is used. This does not require a user name and password because the current Windows login is used. Forms authentication will require a user ID and password.
The third type of authentication is Windows authentication where a user name and password is specified. Use this authentication to log in with a Windows account other than the currently logged in Windows user. To enable this type, under Authentication Type, select the Windows button and then check the Specify Windows User Name checkbox. The user name and password fields will enable. Enter a fully qualified user name, complete with domain and the password.
Click the Test button to verify the authentication settings and ensure that Analyzer can connect to your Project Server instance.
Upon configuring the Project Server settings, the list of available projects will be pulled from the server. During task extraction, the tasks will also be pulled from the server. Filters will be executed locally.
Project files and projects from Project server can be added in the Project Analyzer session, however, Project Sets cannot mix platforms. Multiple sets of different types can be scored at the same time by selecting (checking) the projects before clicking the Analyze button.
[contents]
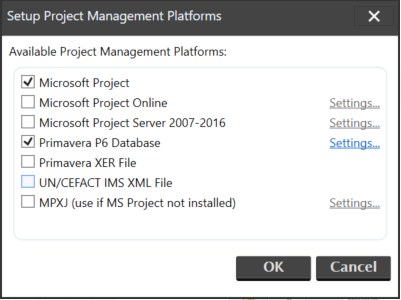
Place a check mark next to Primavera P6. This will
enable the Settings link. Click the Settings link to specify
information about the location of your Primavera database in the Primavera
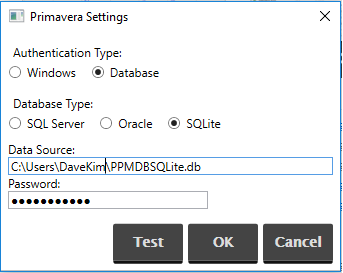
Settings menu.
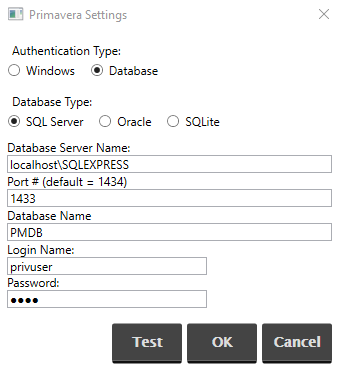
Authentication Type Select Windows if the Windows login credentials are used to authenticate against the database. If a separate user name and password are required, select Database. This will enable the Login Name and Password fields.
Database Type SPA supports SQL Server, Oracle, and SQLite. Please select the database server in use within your organization.
| SQL Server Example: | |
 |
|
| Oracle Example: | |
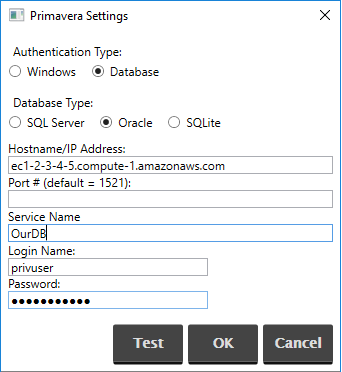 |
|
| SQLite Example: | |
 |
|
Password If the authentication type is Database, this field represents the password accepted by the database server.
Click the Test button to verify the authentication settings and ensure that Analyzer
can connect to your Primavera instance.
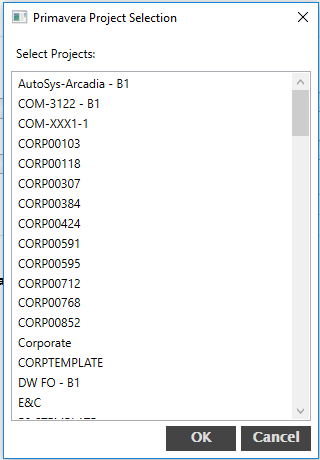
When adding a Primavera project, another menu will present a list of the projects within the database.
Click or shift-click to select and add projects to Analyzer.
When working with Primavera projects, keep in mind that Project Analyzer populates the Text1 field with the tasks' Activity ID.
[contents]
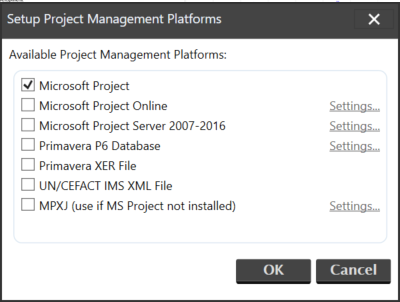
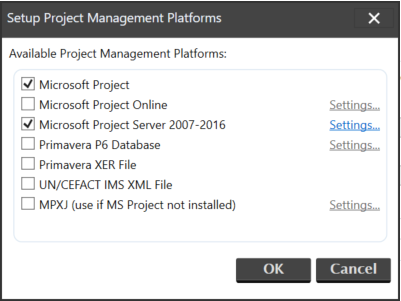
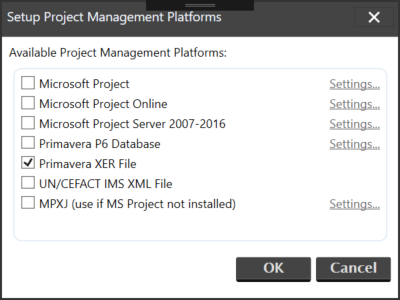
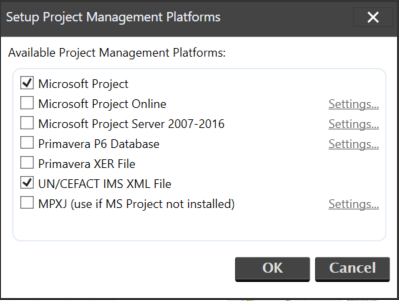
Project Analyzer supports Primavera XER files natively. To add an XER file, you'll need to make sure that Primavera XER File is enabled as a platform. Click the Project Management Platforms option from the Configure menu, and check the Primavera XER File box.
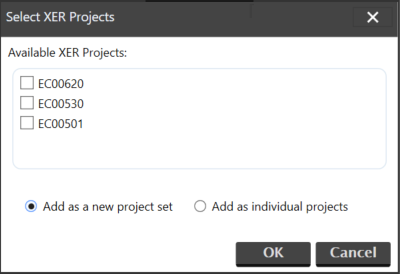
When adding an XER project, after selecting the .xer file, another menu will present a list of the XER projects within the file. Check one or more projects and indicate whether to Add as a new project set or Add as individual projects. The new project set option is the default.
When working with XER projects, Project Analyzer populates the Text1 field with the tasks' Activity ID. Also, there are some reports and report checks that will not run on an XER project. For example, the Critical Path Test and Critical Path Length Index, both found on the DCMA 14 Point Assessment, can only be performed on Microsoft Project (mpp) files.
[contents]
[contents]
The filter builder allows you to build once, use anywhere. Filter builder performs task evaluation within Steelray Project Analyzer instead of within each respective project management planning package. This also allows for greater portability of filters as they can be shared among teams simply by distributing the report.
Filter builder is invoked from the Configure menu by selecting the Filter Builder... menu item. By default, the list of filters is empty.
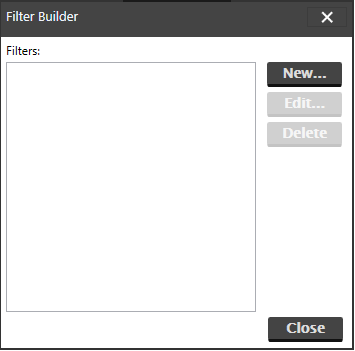
Click the New... button to add a new filter, click the Edit... button to modify an existing filter or click Delete to remove an existing filter.
Adding or modifying brings up the heart of filter builder's functionality.
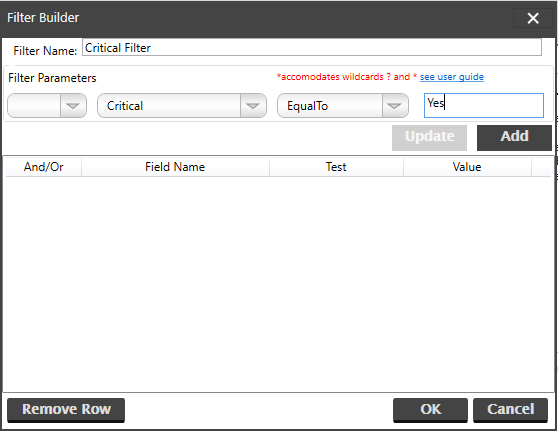
In this case, a filter was created to test if a task is marked as Critical. The first item is the field name, which in this case, is simply Critical. Next, we select an operator. In this example, EqualTo. Because Critical is a Yes/No field, we're testing for the value that is equal to Yes or True.
Once each item is selected from the drop down, click the Add button. This adds this evaluation to the list. This is important to note because multiple conditions can be chained together for a task to evaluate to true or false.
For example, if we wanted only non-summary tasks that have started, the following conditions in the filter could accomplish this.
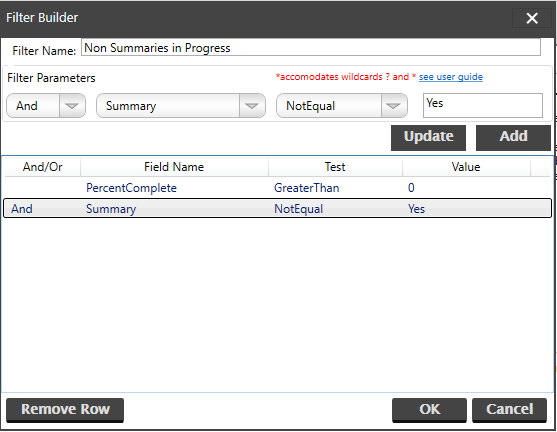
We have strung together two conditions that must be true for the entire filter to evaluate to true. To get to this point, we first selected Summary NotEqual to Yes. Then click the Add button. Now select the And item from the first drop down, followed by PercentComplete from the field name drop down. The test condition is GreaterThan and the value is 0. Click Add once again to put this condition into the evaluator.
If a condition was added inadvertently, click the condition in the list and click the Remove Row button to delete this condition from the list.
Some of the operators will accomodate special characters and values. The Within and NotWithin operators will expect two values separated by a comma. The filter will include items where the field value is between, and not including, the first and second values. For example, "4, 7" will include items where the value is greater than 4 and less than 7. This filter can also be used with a date field.
The StartsWith and EndsWith operators on the Filter Builder will search for values that match the value entered at the beginning (StartsWith) or end (EndsWith) of the identified column value. They will accept Regular Expression syntax in the Value input control. Regular Expressions can be used to search for patterns in the field values. For example, selecting EndsWith and entering "review([\ ]*[\d]*)?" would search for a value ending in "review" or "review <number>". Another example: selecting StartsWith and entering "project[\s s]." would match a value beginning with "project" or "projects" but not "projected". The StartsWith and EndsWith filters are not case sensitive.
The EqualTo and NotEqualTo operators on the Filter Builder will accept the ? and * wildcard characters in the Value input control. The ? character takes the place of a single character and the * wildcard takes the place of multiple characters. For example, searching for a field value EqualTo "obtain legal*" would match values of "Obtain Legal Approval" as well as "Obtain Legal Signoff". Another example: searching for a field value EqualTo "* review ?" would return "Design Review 1" and "Design Review 2" and "Legal Review 1".
[contents]
Pre-filters are available to be applied to Project files before an analysis is performed. For example, if the analysis should only be performed on tasks that are critical, you can create a filter that is executed before the analysis begins. Filters are applied on a file-by-file basis. To set a pre-filter for a project, select the project in the left panel under the Projects listing. Then, in the right panel on the Project Settings display, select the desired option in the Global Pre-Filter section. If the schedule is a Microsoft Project file, the Project filter list will allow the user to select a filter from the schedule. If an Analyzer filter has been created (see the previous section on Using Filter Builder), you can select it from the SPA Filter list.
Note: With the Use Project Filter option, Project Analyzer reads the list of Project filters available from each file. Analyzer will attempt to open the file or database to read this list before proceeding.
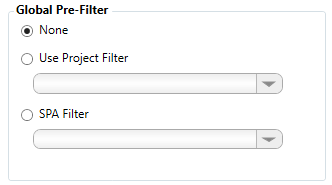
Based on our previous example, this would be a simple way to display only critical tasks by using a SPA filter we created. A Project Filter may also be used. Select the Use Project Filter button and select a filter from the list.
[contents]
The report gallery is designed to provide quick and easy access to create all of the reports available within Steelray Project Analyzer. The gallery provides the initial view of the reports, but subsequent screens may be necessary based on your selection.

When a report is selected, a corresponding report information screen will follow. In the example below, we've selected the scorecard.
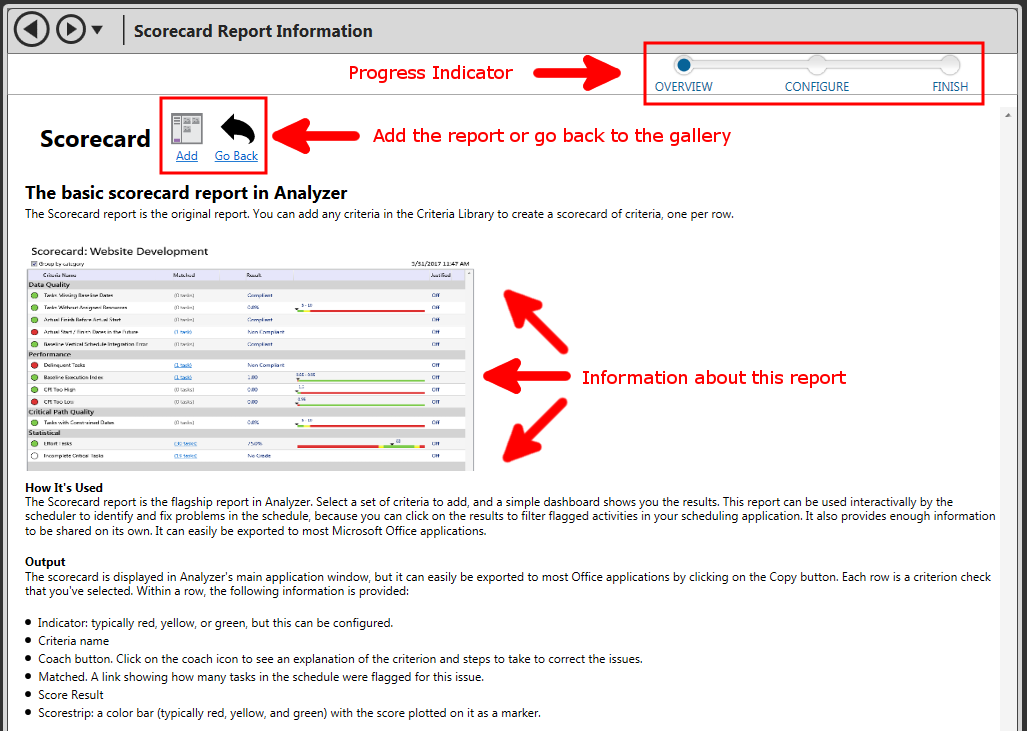
If the Add button is clicked, the report may require additional configuration before an analysis can be performed. For example, the scorecard requires that criteria are selected before it can be displayed.
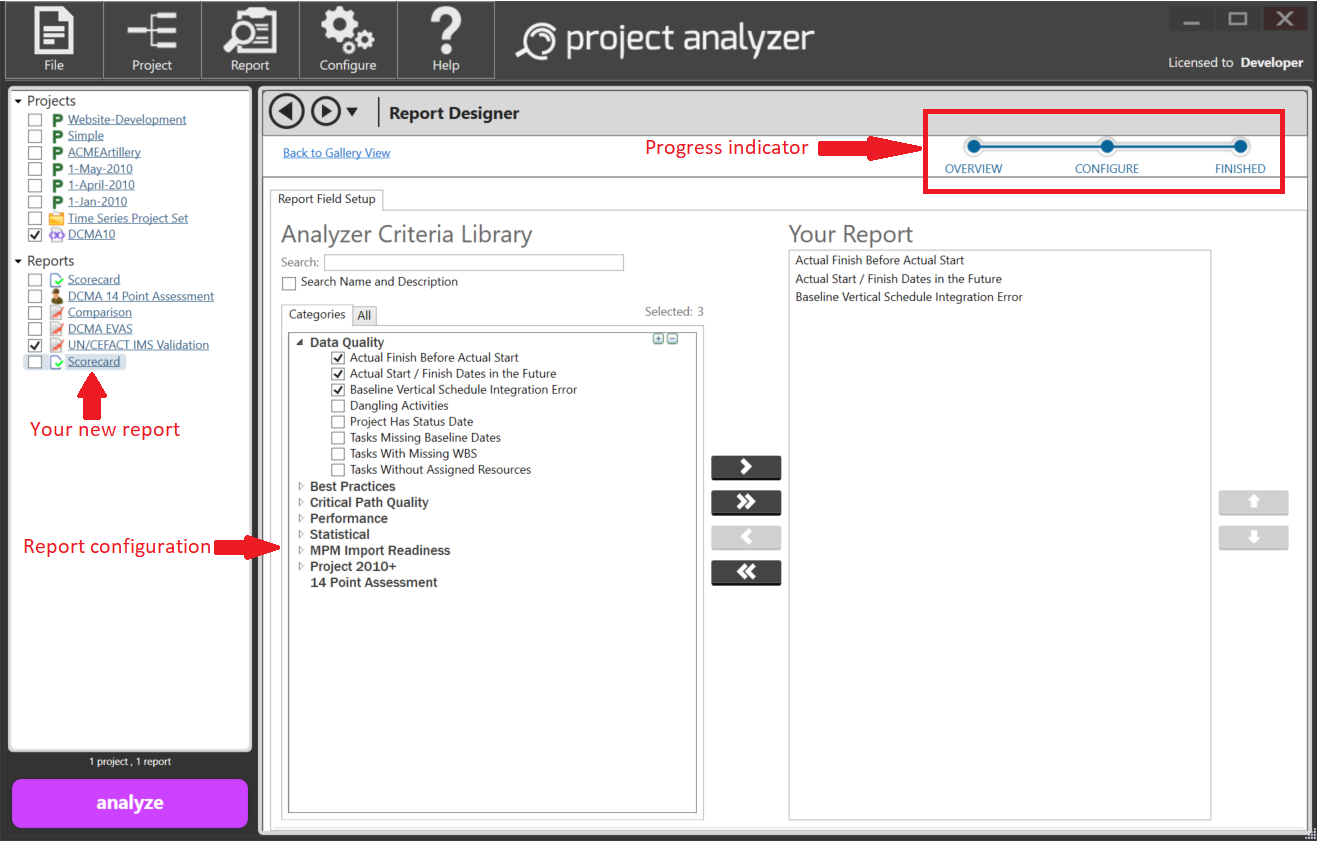
The new report is added and automatically selected for you. The progress indicator reflects the current status. If the report requires configuration this step is preset in the progress indicator. Once enough information is acquired, the progress indicator will change from Configure to Finished. Once finished, simply place a check next to your new report and one or more projects and click Analyze.
[contents]
A Scorecard report is configured by default within Project Analyzer. Without any further configuration, a scorecard will produce robust analysis data for each Project file or set. Similar to single Project files and project sets, a stand-alone single report can exist in the list, or reports can be grouped together as a set. In this section, we'll add a single report and go over the settings.
Steelray Project Analyzer ships with a number of reports. Some contain settings to allow for further customization. This will be discussed later in the Create Advanced Reports section.
In this example, scroll to the bottom of the Report Gallery and select Simple List under the Build From Scratch section. In the Reports list on the left side of your Project Analyzer window, right-click Simple List and select Rename Report Item. Name the report Custom Simple List.
To configure a report, left click on the report item (in this case, Custom Simple List) where criteria items can be selected for display.
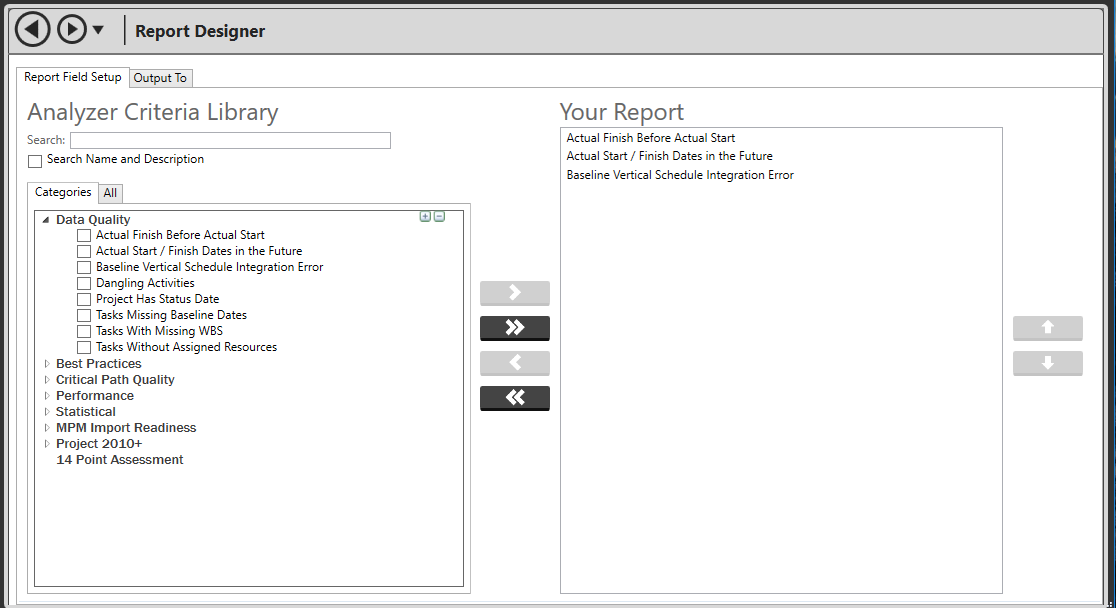
Use the back (<) and forth (>) arrows to add and remove the items to be included in your report. The Categories tab will display criteria grouped by category, and the All tab will display all Analyzer criteria sorted alphabetically. Select items to add to your report by checking them and clicking the >. To add all criteria visible in the list, click the >> button.
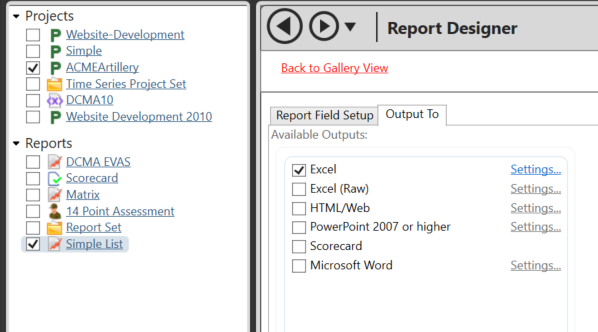
When satisfied with the report items, click on the Output To tab to configure how the score will be rendered.
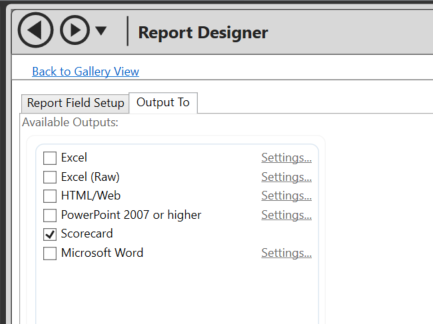
Steelray Project Analyzer comes ready to communicate with a number of popular Microsoft Office products including Word, PowerPoint and Excel. For our scorecard, we're simply going to render the results to the Scorecard. Note that the Scorecard output has no settings. If rendering the output to any other destination, further configuration would be required.
The other outputs will be discussed in the Create Advanced Reports section.
[contents]
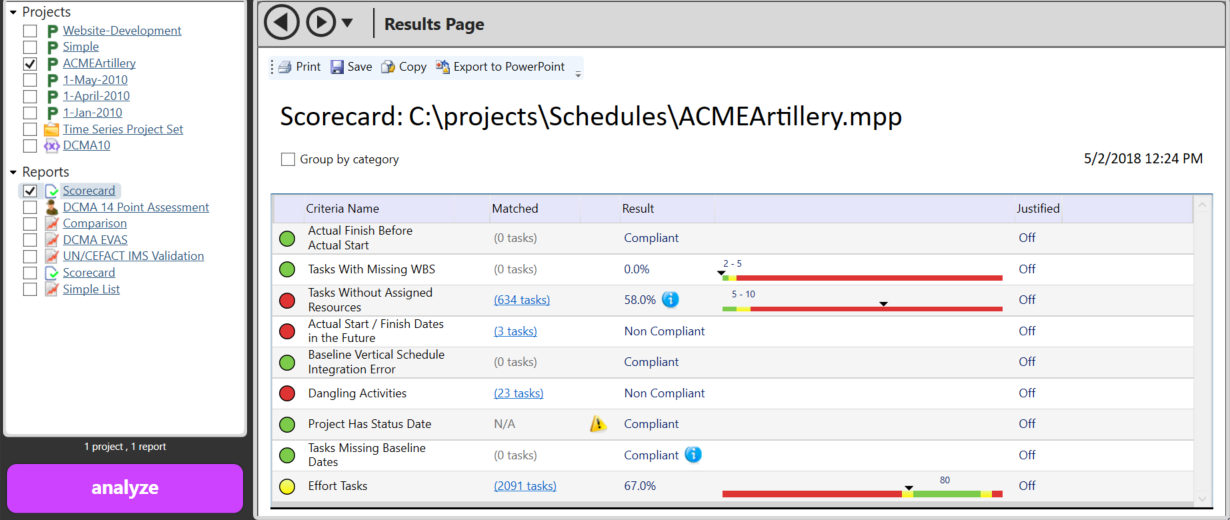
Now that the Project file and report items are set up, an analysis can be performed. To get started, select one or more project files from the Projects list and one or more reports from the Reports list. When this is accomplished the Analyze button will highlight, as shown below.
Click the Analyze button to begin the analysis. When the analysis process completes, results for the selected report will display (in the example below, it's the Scorecard report).
[contents]
One of the most identifiable pieces of Steelray Project Analyzer is the Scorecard. This help topic will walk you through the Scorecard and some of its functionality.
[contents]
The Global Scorecard is a scorecard with a single overall score that you configure. Each criteria can be weighted either with an arbitrary value or based on the color ranking (Green = 3, Yellow = 2, Red = 1). This allows you to weight schedules to your organization specifications.
To create a Global Scorecard, select it from the Report Gallery in the Scorecards section and click the Add link. Select the Analyzer Criteria on the Report Field Setup tab - the section on Creating Simple Reports describes in more detail how to add criteria.
Next, click on the Global Score tab and click the Click here link to change the existing settings for how the global score is calculated.
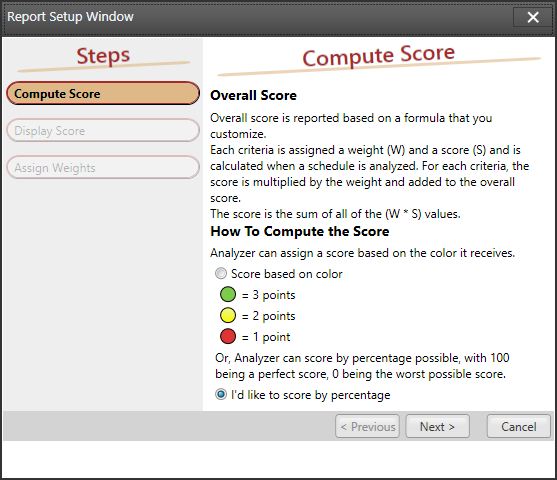
The first screen determines how the score is computed. If the score is based on color, the schedule (input) and criteria definition will be used. For example, if criterion Effort Tasks declares Higher is Better and the green color threshold is greater than 50% and yellow is 30-49% and anything less than 30% is red, a score of greater than 50% will be green and assign a value of three. The yellow will assign a value of two and red, a value of one.
The second option allows you to score by the raw percentage. In contrast to a score based on color, a raw percentage score can offer more vision when something is on the higher or lower side of the color spectrum.
The second settings page, shown below, allows you to configure how the overall score result is presented.
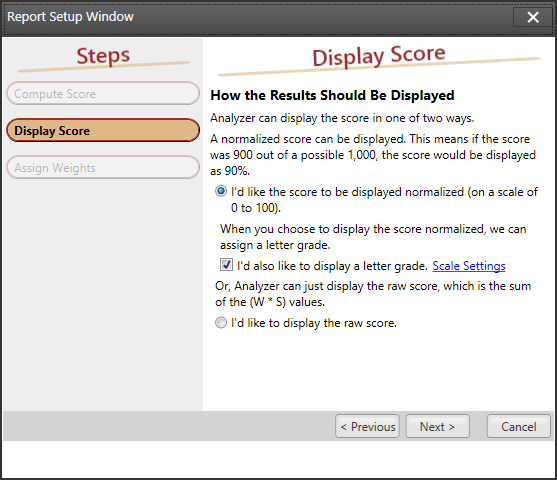
A normalized scale will always be between 0% and 100%. 0% being the worst possible score and 100% being the best possible score. The raw score is simply a sum all of the weights times all of the scores. This number is arbitrary based on your own weighting.
Note: When the normalized score option is selected (where 0-100% is the scoring range), there is an option to assign a letter grade to the score. The default scale is A+ = 100-97, A = 93-96.9, A- = 90-92.9 down to F being anything less than 60. If you're not satisfied with the default scale, click the Scale Settings link to set your own scale.
Applying your own arbitrary weights to criteria is done through the Criteria Manager.
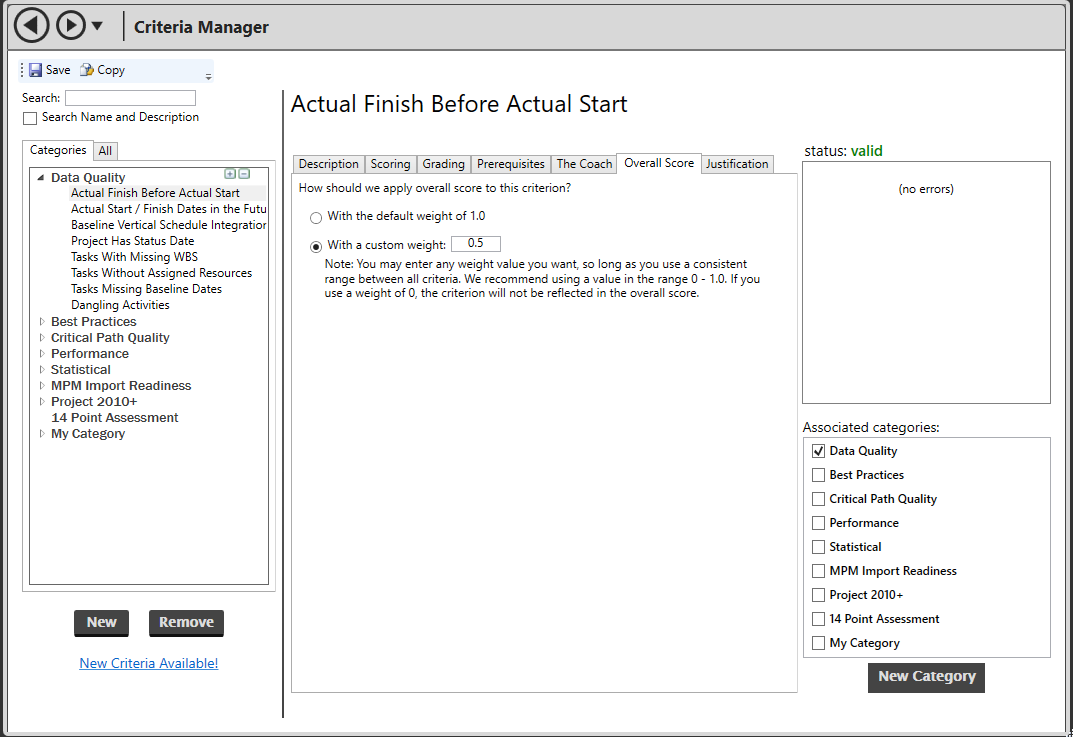
From the Configure menu, select Manage Criteria. Click the Overall Score tab to set a weight. Notice that this screen gives you the ability to exclude certain criteria from weighting. When a criteria is not weighted, the score assumes a weighting of 1.
When the report is configured to the desired specifications, a standard analysis can be performed that includes this report as an output. Everything about this report output remains with the exception of the overall score across the top.
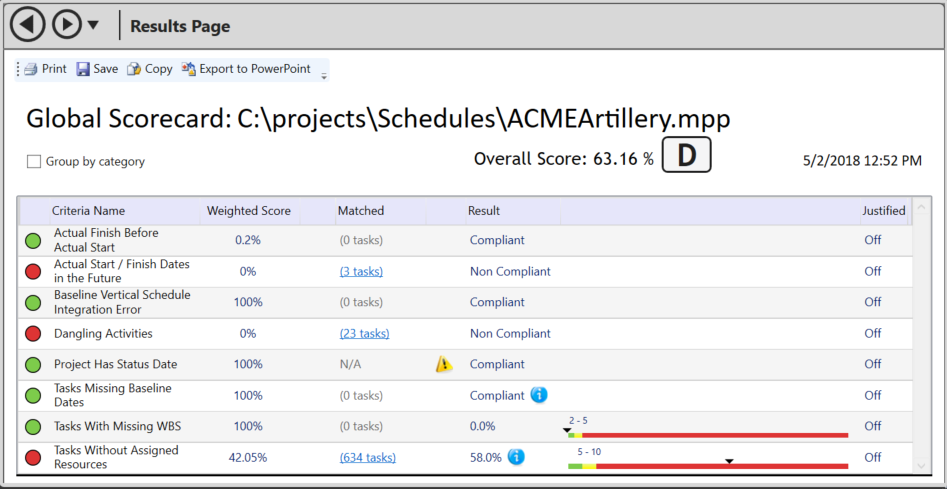
As shown, the overall score (and grade, if selected) are displayed across the top to the right of the schedule name. If you're not satisfied with the way the score is presented, you can change the presentation.
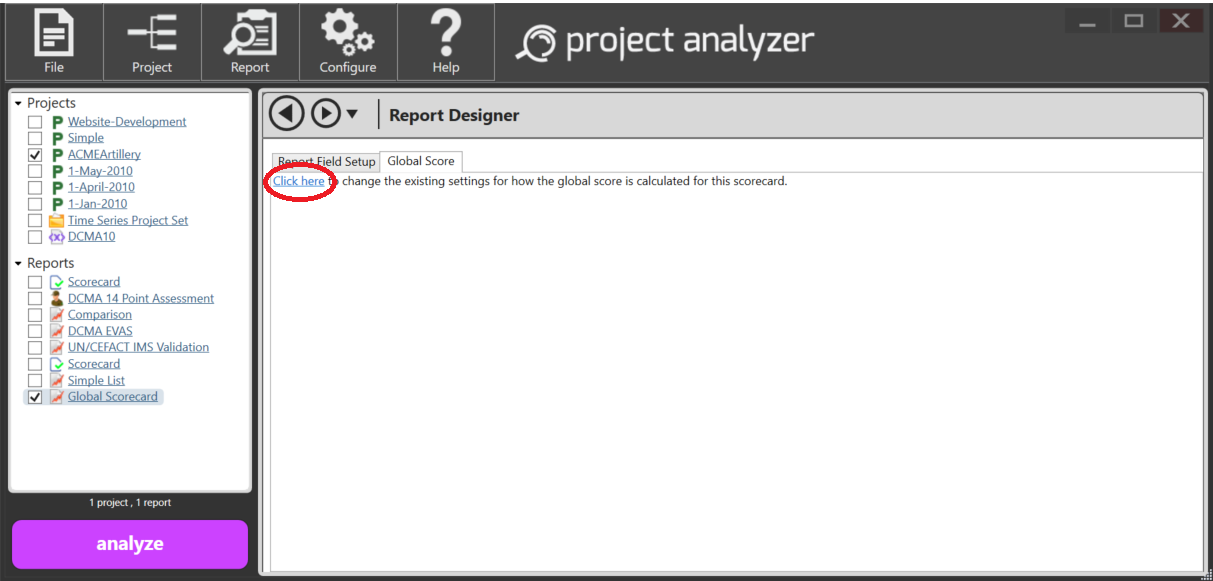
Click on the report name in the Reports listing, select the Global Score tab, and click the link (circled above). The wizard used to configure the report will be presented and all options can be modified as desired.
[contents]
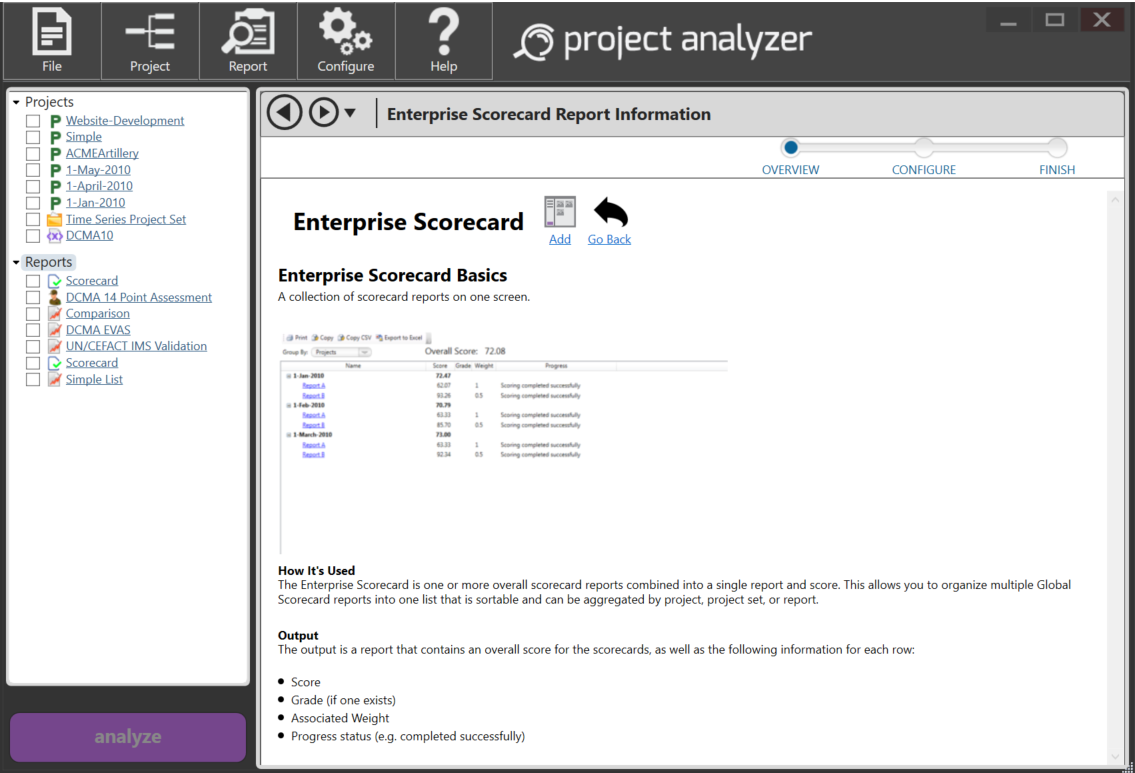
The Enterprise Scorecard report is one or more overall scorecard reports combined into a single report and score. This allows you to organize multiple overall scores into one list that is sortable and can be aggregated by project, project set, or report.
Because the Enterprise Scorecard is dependent on one or more overall scorecards, the first step is to create one. If you have an overall scorecard on hand, you may use it in the scorecard of scorecards.
Note: The Enterprise Scorecard report also allows you to create an Overall Scorecard in the report settings.
Add the Enterprise Scorecard report by selecting Enterprise Scorecard from the Report Gallery and clicking Add.
Once the report is created, it will show up in the Reports list just like any other report, however, additional configuration is still required. Next, one or more Overall Scorecard reports must be added.
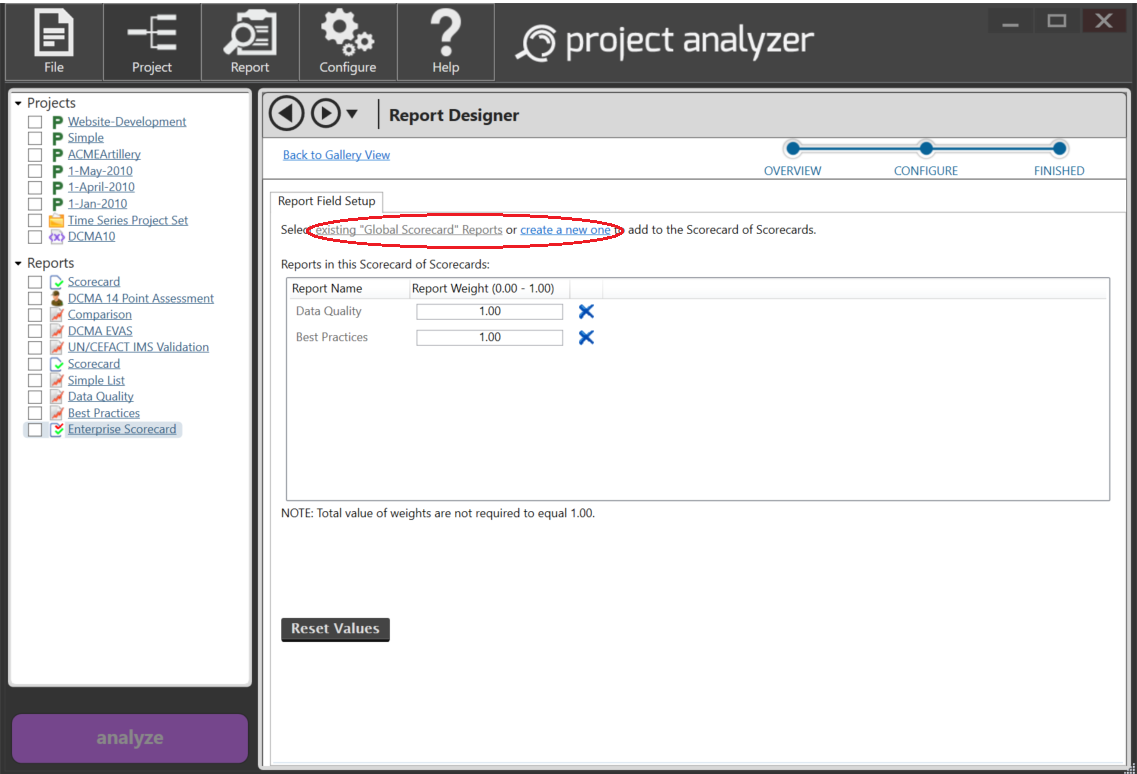
After clicking on the Enterprise Scorecard, the report configuration screen (pictured above) contains the controls to create, add and remove overall scorecards. The two hyperlinks at the top center of the screen are for adding existing overall scorecards or new overall scorecards. After adding overall scorecards to the report, they can be removed by clicking the blue X.
Note: Clicking the blue X does not delete the overall scorecard report from Project Analyzer, it simply removes it from the Enterprise Scorecard container.
Weights can be changed via the number boxes within the weights column, the default value being 1.00. Values are automatically saved upon changing, though they may all be reset to the default of 1.00 via the "Reset Values" button.
Note: Weights are normalized, double precision values (i.e. rounded to two decimal places) and can only equal values between 0 and 1.
At this point, select one or more projects from the Projects list and click Analyze.
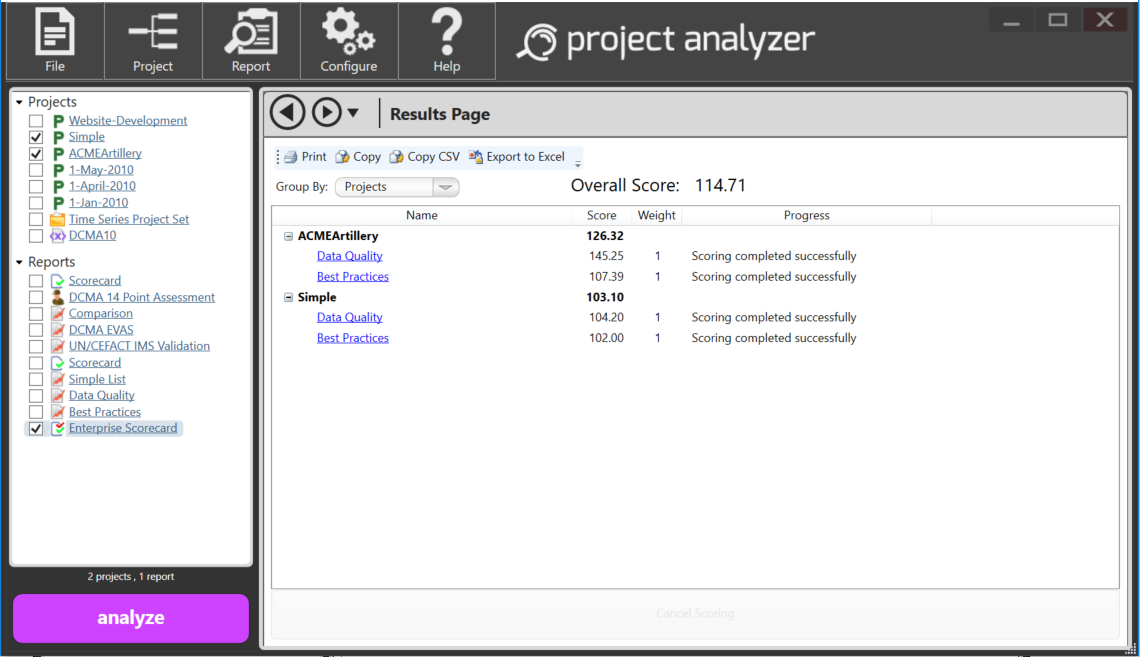
In this case there were two projects and two overall scorecards. You can click the headers to sort by the scoring percentages or grade to bubble problem children to the top. Click any of the report hyperlinks in the list to reveal the underlying overall scorecard.
While any of the columns can be clicked for quick sorting, it is also worth noting that the way the results are aggregated can be changed as well. The Group By dropdown list at the top of the report will change the top level node. The default is Projects, but the report can also be grouped by Reports.
[contents]
The Validation Report is a tool for identifying and troubleshooting corruption and other problems with an integrated master schedule (IMS) specifically for Microsoft Project files. With an integrated master schedule (IMS), it is common to link to tasks in external subprojects or to have subproject tasks that link to other subproject tasks. Because subproject files can be opened independently of their master schedule, or "backup copies" can be made sometimes causing links to be invalidated, it is important to have a way to quickly identify issues with the IMS as a whole that could invalidate your critical path.
After selecting and adding the Validation Report from the Report Gallery, the Validation Report settings screen allows you to select or deselect checks to be performed. The report will show the results of the following checks:
Each check contains a detailed explanation that can be viewed by clicking the "What is this?" link next to the check itself. The coach content explains what the check is looking for, how this might have happened, and how it can be corrected.
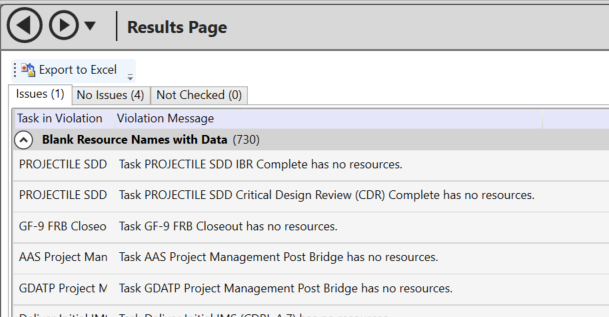
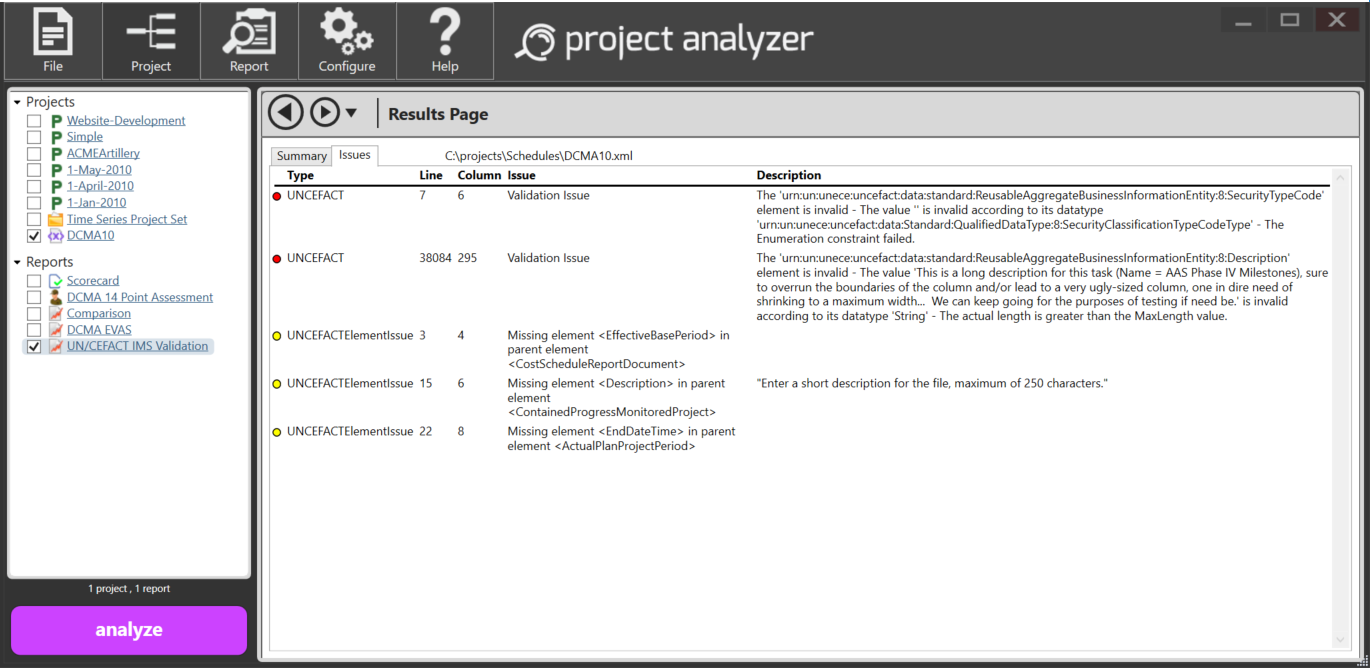
The tabs across the top of the output separate the issues into three sections. The first tab contains checks that were run where issues were discovered. The second tab contains checks that were run, but no issues were encountered. The final tab reflect checks that were not run.
The first tab breaks out the issues by check. The first column contains the task name and unique ID that was identified in the violation. The message reports details of the violation.
When violations are corrected, re-run the Validation Report to ensure that the check comes up clean. Optionally, the validation results can be exported to Microsoft Excel. An installation of Microsoft Excel is required to perform this function. The export mimics the tabbed output on the screen. Each tab on the screen will have a corresponding tab within Excel. The issues uncovered will be listed as tables.
[contents]
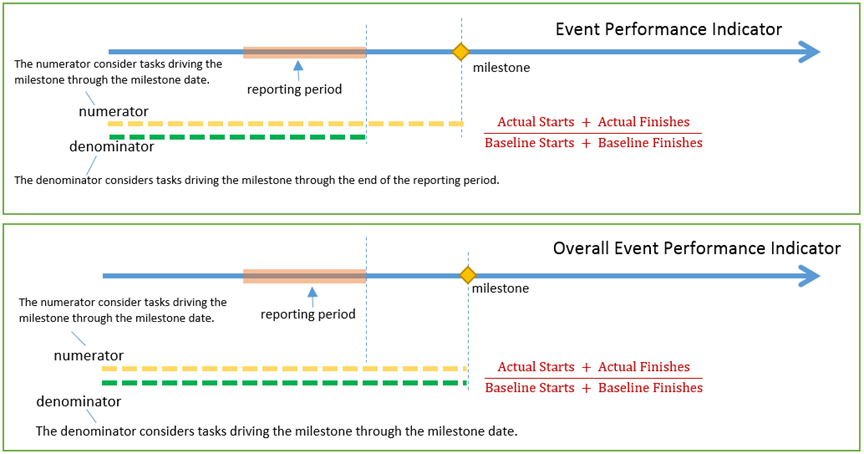
There are a number of schedule performance metrics. The Milestone Indices look at performance and progress focusing on specific milestones. There are two metrics in the Milestone Indices Report. The Event Performance Indicator (EPI) and the Overall Event Performance Indicator (OEPI). The first calculation (EPI) looks at the performance of the work being done that affects this milestone. Like many indices, 1.0 is on schedule, greater than 1.0 is ahead of schedule, and less than 1.0 is behind schedule. The second calculation (OEPI) will start at 0.0 and move toward 1.0 at completion of the milestone. It can be used as a progress indicator, or alternatively an alternate measure of percent complete toward the milestone.
Calculation
For each specific milestone, we look only at the tasks (activities) that are driving the milestone, and calculate the formulas in this way:
(Actual Starts + Actual Finishes) / (Baseline Starts + Baseline Finishes)
The difference between the two formulas lies in which tasks we consider in the denominator:
Running the Report
The Milestone Indices report is part of the Report Gallery. To begin, select the Milestone Indices report from the gallery. Next, select the newly generated report under the Reports heading and select the project to analyze from the Projects heading.
Note: The Milestone Indices report relies on baseline dates, please be sure to baseline your schedule before running this report.
After clicking the Analyze button, the report will appear.
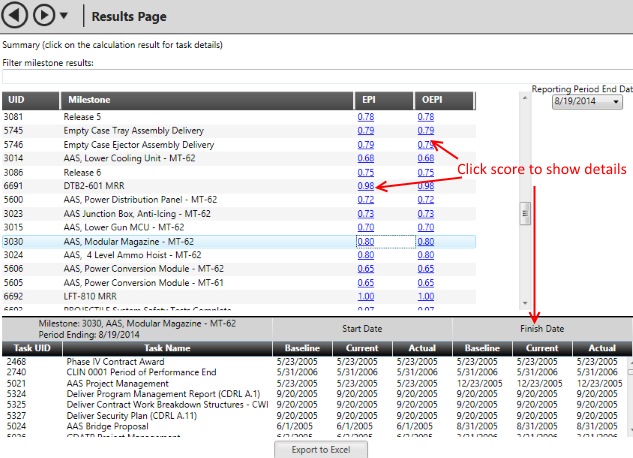
The two calculations, EPI and OEPI are columns next to each milestone name. To view the tasks that comprise the calculation, click the hyperlinks that correspond to the milestone task and the calculation. The detail tasks are displayed below.
The reporting period as it relates to the EPI calculation can be changed on the upper right. When a new date is selected, the values are immediately recalculated. On large schedules, this could takes a few seconds.
Finally, to get the values and task information from Steelray Project Analyzer and into other applications or spreadsheets, an Export to Excel feature is available at the very bottom. Click this button and all of the calculations and related tasks will be sent to an Excel file.
[contents]
In a report, a matrix is used to display aggregate summaries for grouped data in a dataset, similar to a PivotTable or crosstab report. Typically, a matrix does not include detail data, however, the tasks that comprise the cross-section of the matrix can be drilled down into within the respective product management platform. The grouped matrix report can simply be considered a cross section of where a grouping and tasks that match a criterion intersect.
The example below groups the results by CAMs associated with this project.
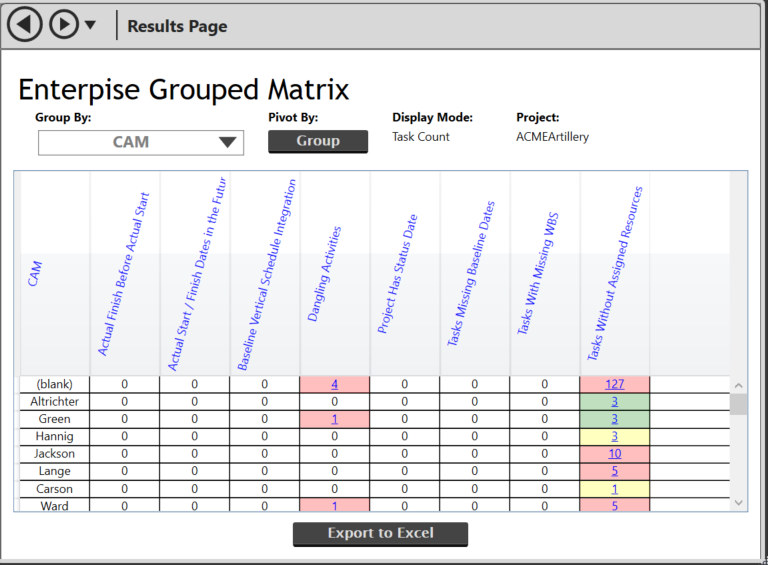
Each CAM is represented along the Y-axis and the criteria along the X-axis.
When there are 1 or more tasks that match the cross section, you can click the hyperlink to drill into the schedule itself to identify the matching tasks.
The entire matrix can be exported to Excel by clicking the "Export to Excel" button at the bottom of the report. The Excel report mimics the screen report. The hyperlinks within Excel will link to task sheets so that the entire report is self-contained.
[contents]
Sometimes your tasks will fail certain criteria, and that will be completely acceptable to you. However, others who analyze your schedule in SPA may view these failures as oversights on your part. You need a way to communicate to those people why you consider a particular task to be an exception to the rule.
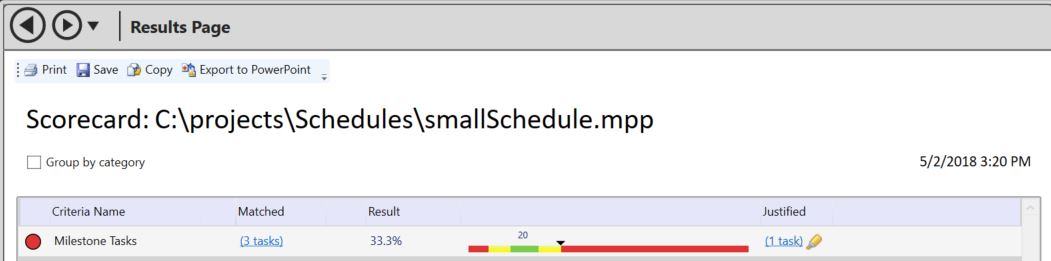
Justification is a feature that lets you do precisely that. Suppose we have a schedule with nine tasks, three of which are milestones. If you run a scorecard with the Milestone Tasks criterion on this schedule, you'll see we're in the red:
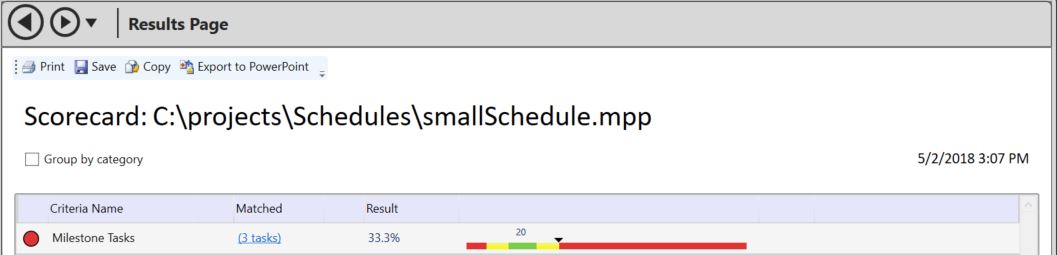
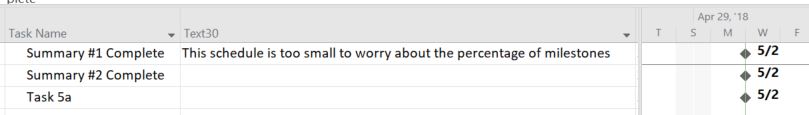
For such a small schedule, we're not really concerned that our schedule is more than 30% milestones, so we won't bother fixing it. Let's justify this decision to the other people who analyze our schedule. We give our justifications in a text field in project. In SPA, each criterion that you want to provide justification for needs its own text field. In our example, we'll use Text30 to provide justifications for the Milestone Tasks criterion. Click on the link in the Matched column to view the tasks in the schedule. The next screenshot shows how we justify the first milestone in our schedule:
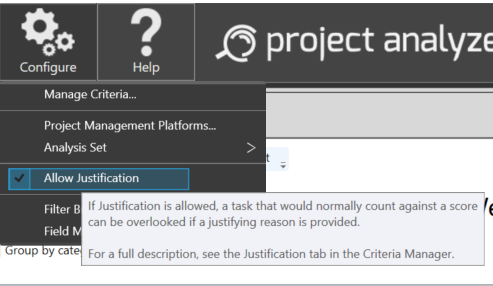
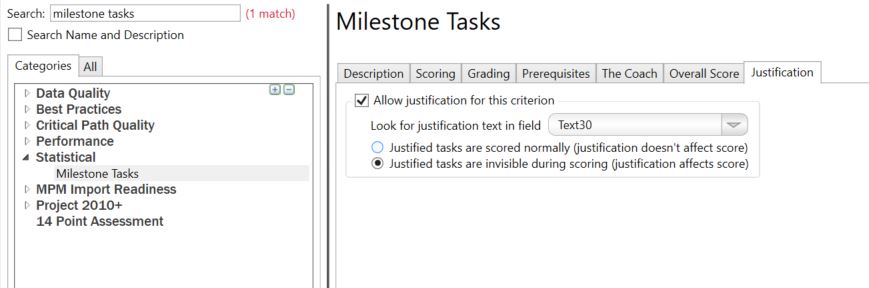
Now we need to tell SPA how we're using justification. First we need to make sure that Justification is turned on for the application, by making sure the Allow Justification box is checked on the Configure menu:
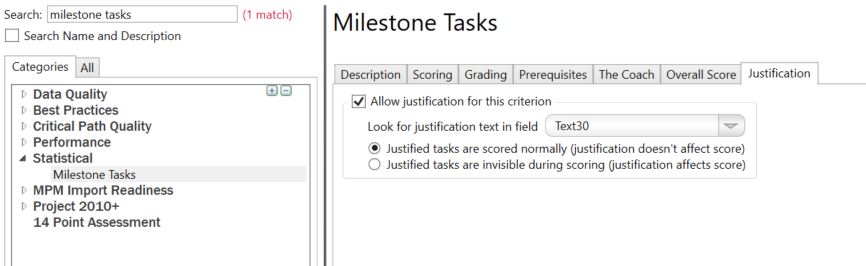
Then we need to open up the Criteria Manager by clicking on Manage Criteria... in the Configure menu. Navigate to the Milestone Tasks criterion, and click on the Justification tab. To tell SPA to allow justification for this criterion, click the Allow Justification for this Criterion checkbox. Then select Text30 from the dropdown box. For now, you can ignore the scoring mode radio buttons. Your settings should look like this:
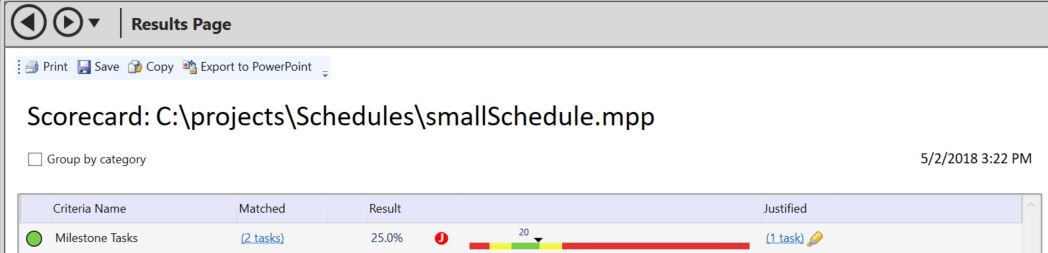
Now we're ready to see our justification. If we rerun the scorecard, we see the following output:
Notice the new Justification column. This column tells us that one task was justified for the Milestone Tasks criterion. Just as with the Matched column, you can filter and highlight the justified tasks in Project by clicking on the link and the highlighter icon.
It's nice to be able to justify tasks, but sometimes we would really like to keep certain tasks from being scored at all. You can do this by selecting the "Justified tasks are invisible during scoring" radio button on the Justification tab in the Criteria Manager:
If you now rerun the scorecard, you'll see that the Milestone Tasks criterion is reporting one fewer milestone than expected. In fact, the justified milestone task has now been completely hidden from the scoring system. SPA shows a red "J" icon next to the score, to indicate that the score has been affected by Justification. This is considered an advanced feature, and should be used with care.
[contents]
This report will analyze a Project Set containing a set of snapshots, or previous copies of a schedule. On the Project Settings page, select the checkbox All files are snapshots of the same schedule to indicate that a project set contains snapshots.
On the Report Designer page, the Available Fields reflect all of the fields available in Steelray Project Analyzer plus some additional statistics such as:
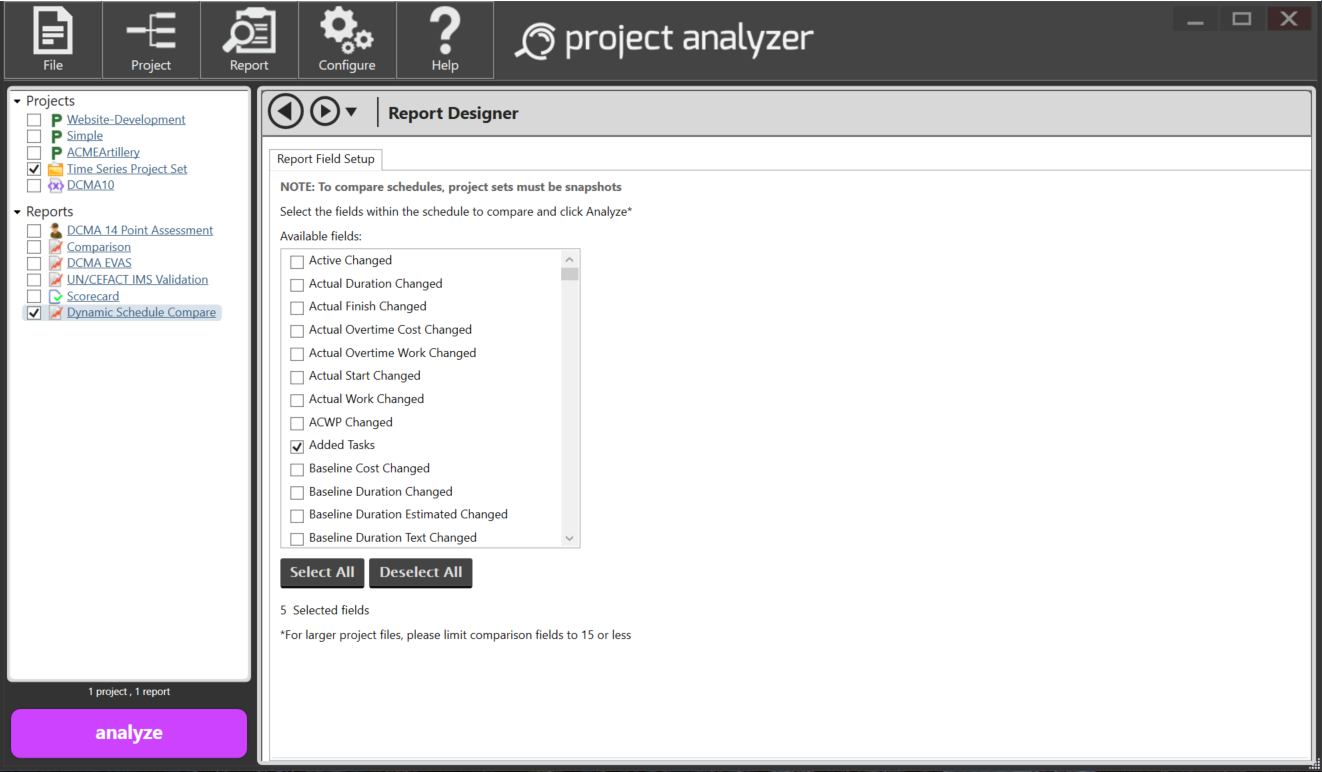
Once the desired comparison fields are selected, click the Analyze button.
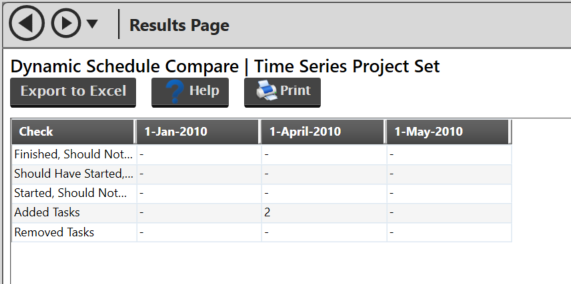
The results are displayed in a grid. A dash reflects no changes between the two schedules. If there is a difference, a value is displayed. This number is clickable and will filter the differences in the schedule. For example, if this is a Microsoft Project schedule, Microsoft Project will load and filter the tasks that are different. Likewise with Primavera.
All of the comparison data as well as task information can be exported to Microsoft Excel by simply clicking the Export to Excel button.
[contents]
The Grouped Bar Chart report represents criteria scores grouped by custom fields. For example, you may group your CAMs in the Text22 field within your schedule. SPA looks for all unique names within each custom field (that is named) and aggregates the issues by unique names.
To configure, simply pick any of the criteria from report's Criteria Manager on the Report Designer and analyze.
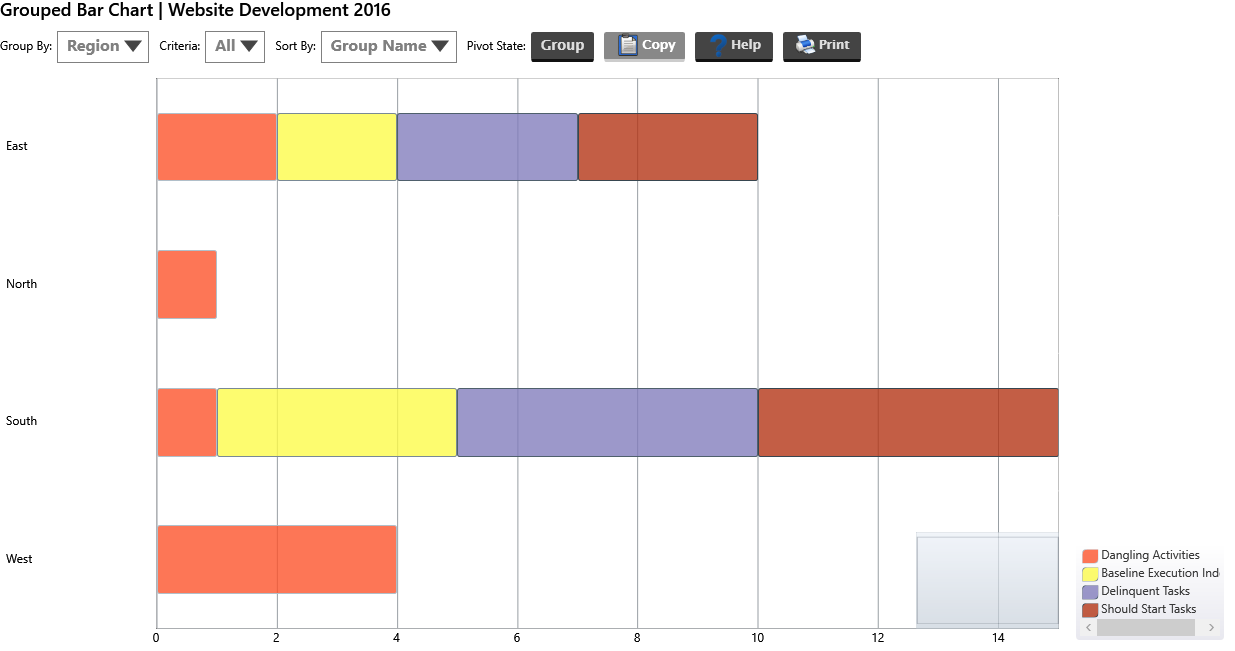
When the report is displayed, each issue that is checked will be stacked in a bar and the legend for the colors representing the tasks is in the lower right. Options for changing the view of the presented scores, as well as Copy, Help, and Print buttons are above the report results.
[contents]
The Tree Map groups the issue together by unique names with groups that have more tasks assigned to them consuming more of the screen. The color of the blocks represent the scoring, just like the scorecard. Red is a failing grade, yellow requires attention, and green is a passing grade.
To configure, simply pick any of the criteria from Criteria Manager and analyze.
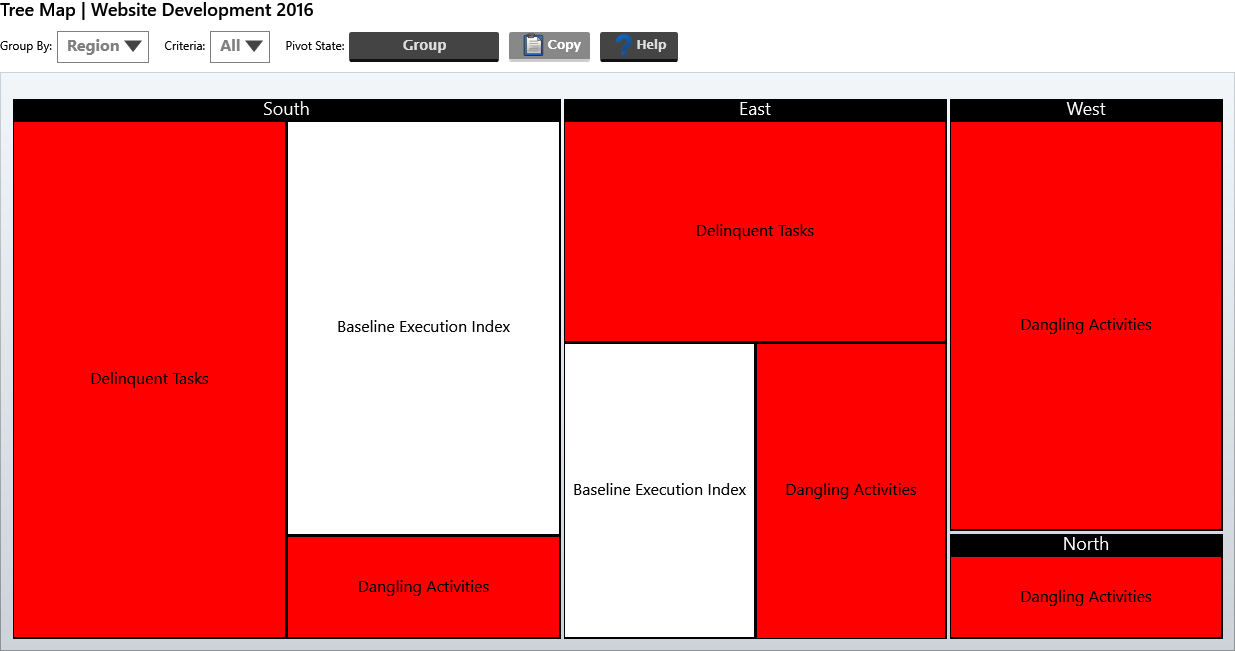
When the report is displayed, each issue that is checked is aggregated by group and represented as a box colored red, yellow, green or white. The size of the box represents how many tasks are affecting the issue. Larger boxes mean more issues and may require more (or less) attention.
Options for changing the view of the presented scores, as well as Copy, Help, and Print buttons are above the report results.
[contents]
The Schedule Comparison Graph allows you to visually compare tasks between two or more projects. To configure, simply pick two or more schedules, place them in order using the up or down arrows, and click analyze.
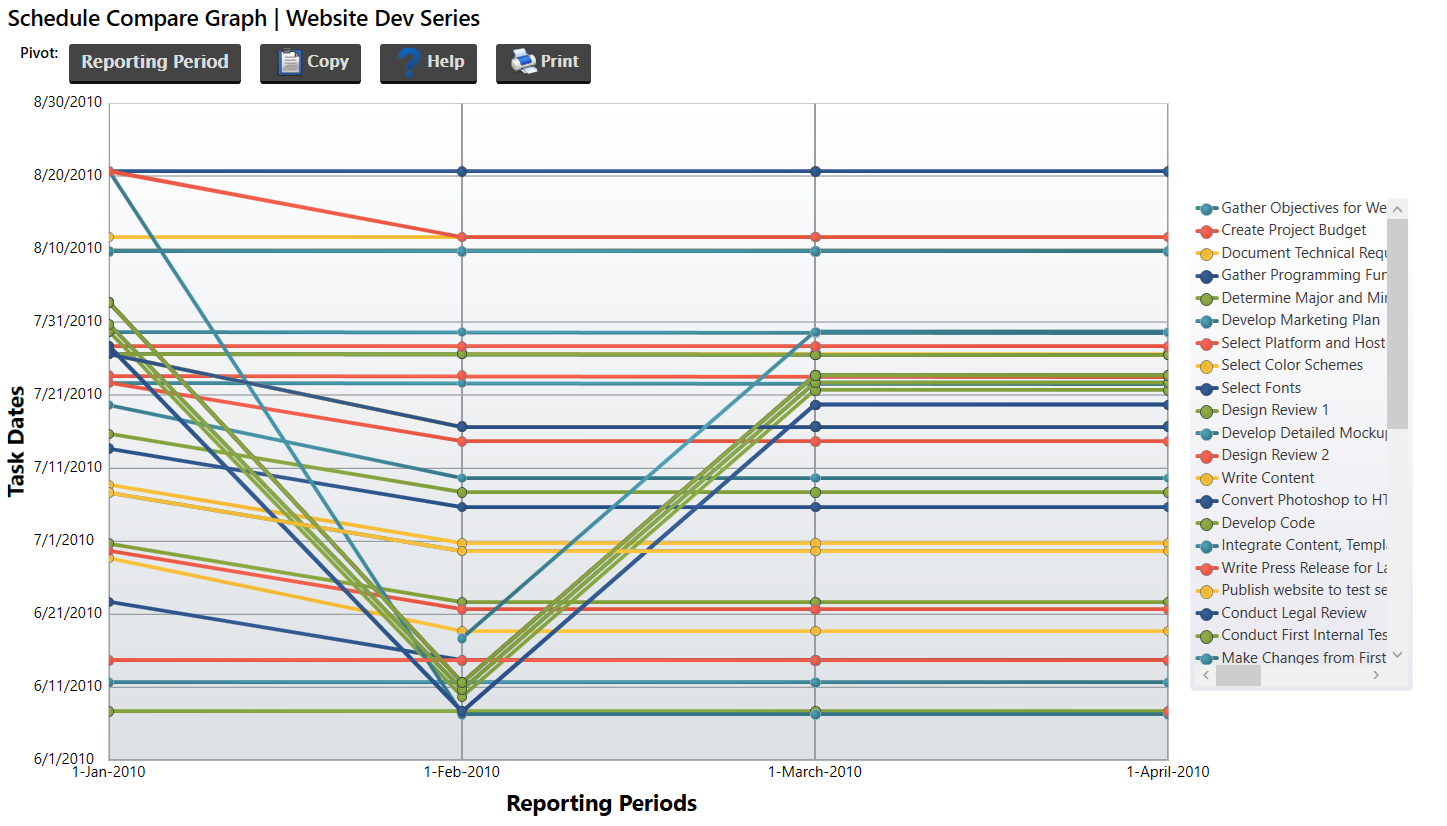
When the report is displayed, you should see a trail of each task from one reporting period to another, signifying their respective date changes. Options for changing the graph's content are above the report results.
[contents]
The DECM report consists of 15 automatable criteria from the Earned Value Management System (EVMS) Compliance Metrics, version 3.2, used by DCMA for compliance oversight. When adding this report, you click the Show Task Detail Tables checkbox to include task names and their id's in the report results. Also, note that a set of snapshots, or previous copies of a schedule, are used in the 06A504a and 06A504b metrics. To indicate that a project set contains snapshots, select the checkbox All files are snapshots of the same schedule on the project settings page. The status dates in the schedule will be used to determine the order for the snapshots.
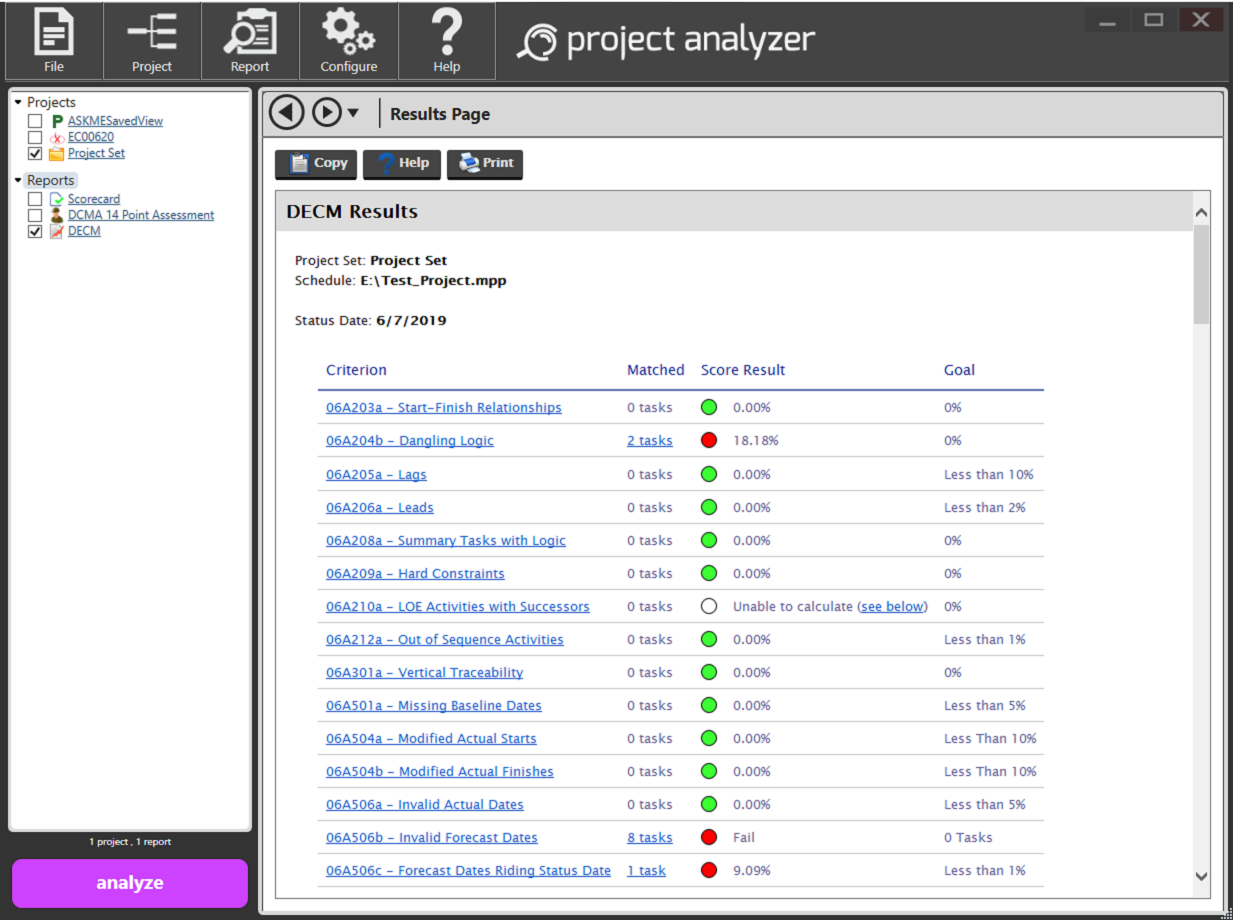
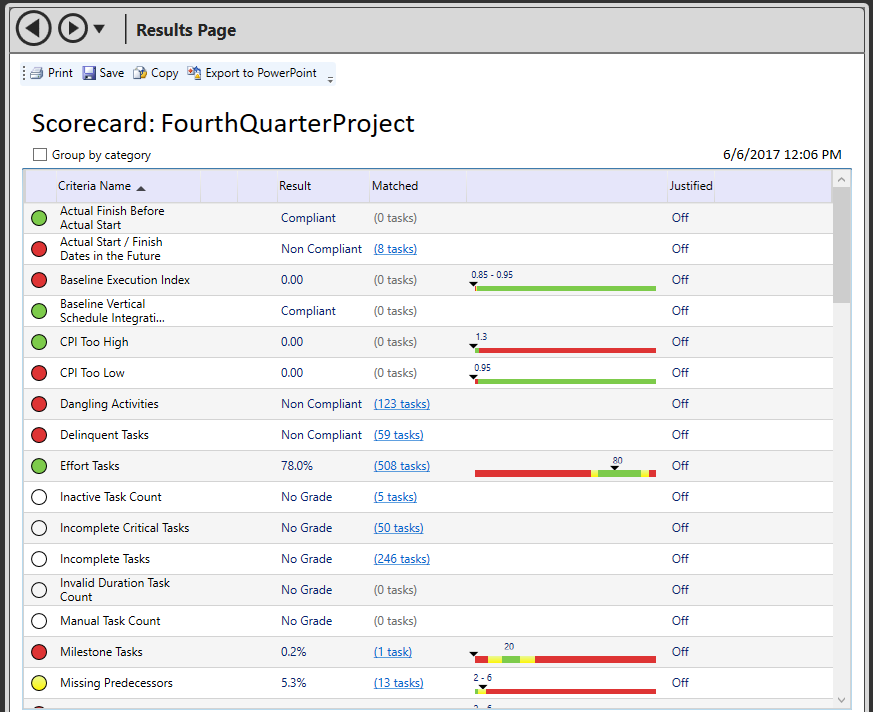
When the results are displayed, you can see the results in a scorecard format with a link to view the matched tasks, a color-coded score indicator, the quantifiable result, and a description of the goal. Each of the criterion will link to a more detailed description of the metric.
[contents]
Simple reports are only the beginning of the reporting capabilities in Project Analyzer. There are a number of other report styles out of the box. They include:
The first three reports have a specific format and purpose. Matrix and Comparison reports are flexible and therefore require additional setup, which will be detailed later.
Excel Analyzer Scorecard - This report is similar to the on-screen scorecard, but the output is put into a native Excel format. Microsoft Excel is required.
Float Distribution Report - Displays total float range of unfinished tasks and milestones. Comparing "in progress", near-term and long-term for effectiveness of schedule reserve. This report is rendered in Microsoft Excel. Microsoft Excel must be installed to use this report.
Hard Constraints Report - This report will identify all hard constraints in a schedule. The hard constraints are must finish on (date), must start on (date), start no later than (date) and finish no later than (date).
Each of these reports do not require criteria selection but do have additional settings that can be configured. These are typically settings that fine tune the look and feel of the final output and not necessarily the calculations.
A matrix report contains custom criteria definitions. The definitions are laid out vertically and horizontally on the report surface.
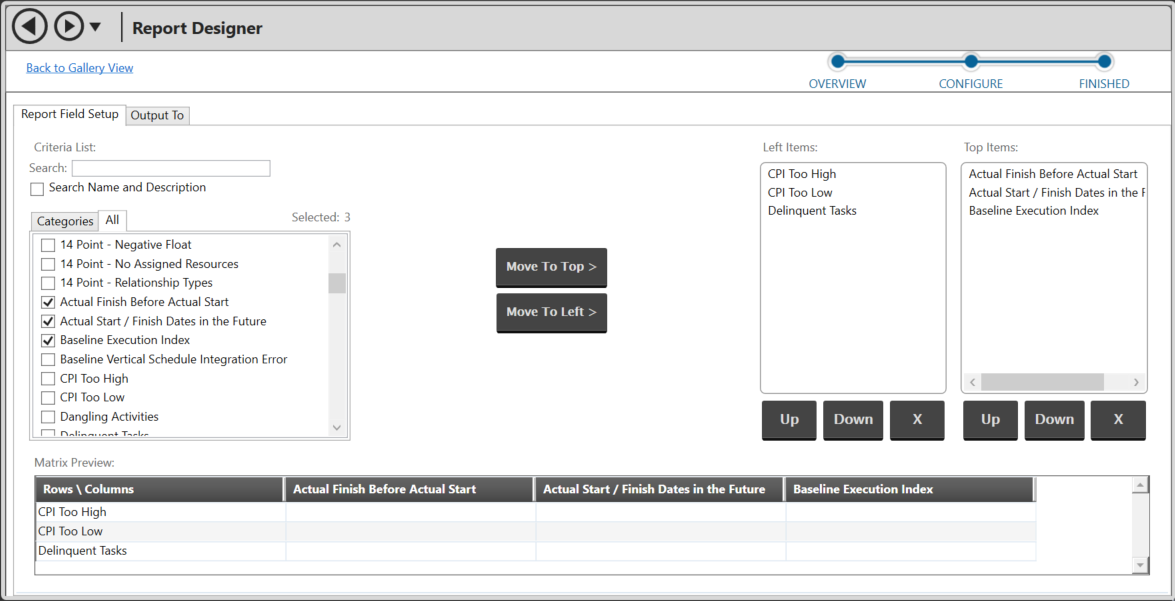
To build a matrix report, select criteria items from the list on the left. Place the items across the top and left. An item can only be placed in each list one time.
When the matrix report is generated, a cross section of scores is produced. For example, in column 1, row 1 where the top level criteria is Summary Tasks and the left hand side criteria is Incomplete Tasks the score would represent tasks that were summary and incomplete.
The Comparison report type allows the user to see criteria over time. The project set should be a collection of versions of the project files. The report configuration is the same as the simple list report. You may select the criteria from the criteria library for analysis just as you would in the simple list. The difference between the simple list and the comparison report is that each of the projects in the set will be listed along the top of the matrix and each criteria score will be listed across the left side. This report requires two or more Project files.
[contents]
Report sets, like project sets, are simply a grouping of one or more report definitions. This is particularly convenient if there is a logical collection of reports that need to be analyzed on a regular basis. If the report definitions already exist within the Reports list, place check mark by each item, right click and select Create Report Set From Selected.
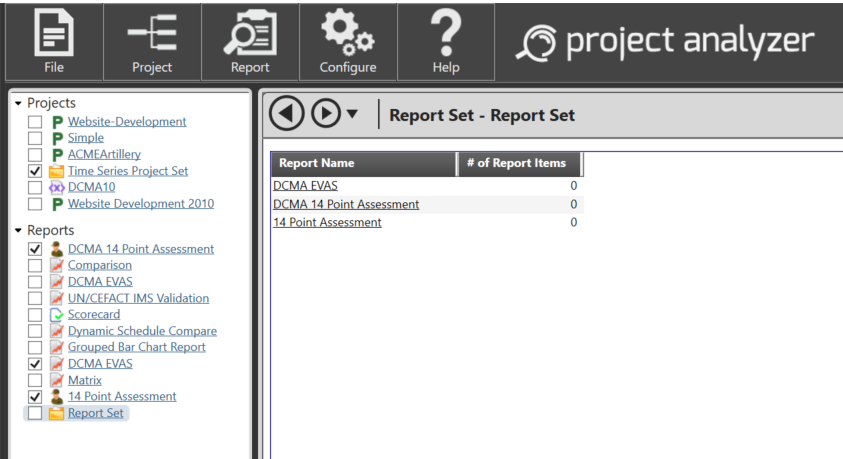
Upon navigating to a report set, a list of reports that are contained within are displayed, similar to the screen above. Click on the report name to modify the settings or items that this report contains.
[contents]
Report Templates allow for customizing output in various Microsoft Office products. Out of the box, Steelray ships with templates for use with Simple List, Matrix, and Comparison reports. These can be found in the Templates folder off of the main installation folder (C:\Program Files\Steelray Software\Steelray Project Analyzer is the default location). These templates are ready for use.
For example, we can use a report template to output a Simple List report to Microsoft Excel. Start by creating a Simple List report. Move the desired fields over to the Displayed column. Now click the Output to tab and select the Excel output as shown below.
Next, click the Settings link to configure a template.
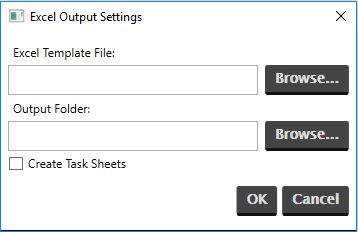
Click on the Browse... button and navigate to the Templates folder. By default, this is located in the C:\Program Files\Steelray Software\Steelray Project Analyzer\Templates folder. Here you'll find templates for the Comparison, Matrix, and Simple List reports. Navigate to the Simple List\Excel folder and you will find the file named Excel-Simple-Report-Template.xls. Next, select the desired output folder. This is where the template and data will be merged to form the final output. Optionally, you may create the task sheets that are associated with each item. This means that each Project task that matches for a particular criteria will be created in an Excel sheet for easy reference.
Steelray also ships with templates for Word, PowerPoint and HTML.
Note: You must have Microsoft Excel 2003 or later installed to use Microsoft Excel templates.
[contents]
In addition to using the templates that are already in Project Analyzer, you may also customize your own templates. The report templates that ship with Steelray Project Analyzer are not proprietary. However, there are some specific commands that tell Project Analyzer where to begin placing analysis data. This allows for you to add formatting, logos and other static content around the dynamic scoring data.
As an example, we can open up the Excel template that ships with Steelray Project Analyzer within Microsoft Excel.
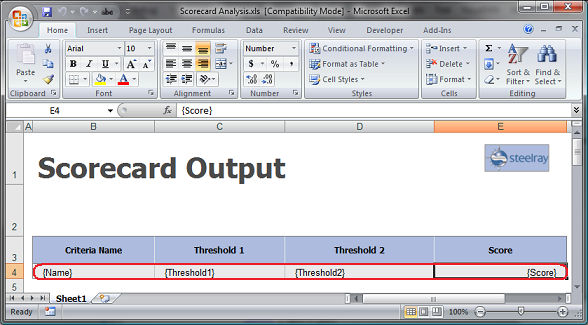
The static content such as the name, Scorecard Output, the Steelray logo and the heading are all very clear within the spreadsheet. Notice that the area highlighted in red contains markup to dictate where the scoring values begin and which values to place where. All of the special tags for Steelray begin and end with braces ({ }). If we want the name of the criteria, the tag is {Name}. This tells Project Analyzer to substitute the tag with the actual name of the criteria. The tags that Project Analyzer recognizes are:
Now it is possible to add your company logo, color scheme and most anything else available within the Microsoft Office product line to make the final report look exactly how you'd like.
To apply dynamic information to Matrix and Comparison reports, the tags are a bit different. Since these reports are always represented as tables, it is necessary to specify where the top and left hand axes begin. The two parameters that are required are {x-axis} and {y-axis} as in the snapshot below.
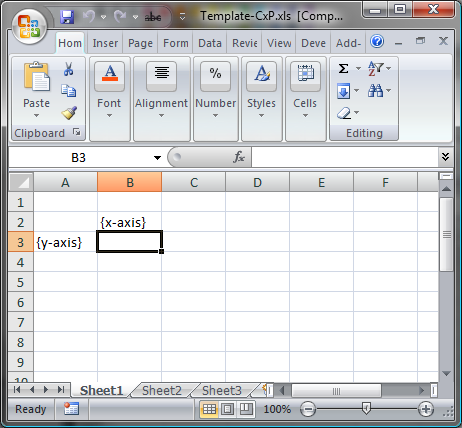
Note: Matrix and Comparison reports only support name and score.
[contents]
Analysis sets are simply sets of sets. Analysis sets group project items and report items into a single unit. When grouped, a set can be selected with a single click.
To create an analysis set, select the items in the Project and Report lists that are to be a part of the analysis set. Right click on either the Project or Report items in the list.
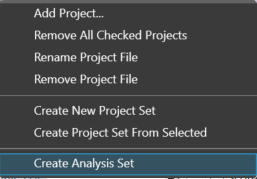
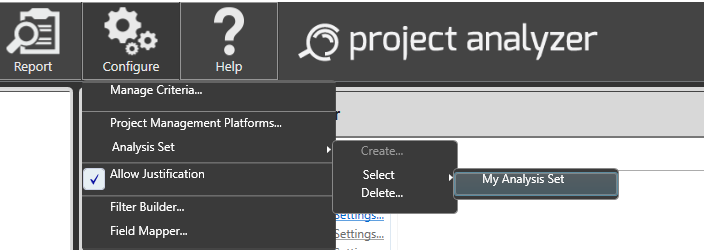
Finally, name your analysis set. This set name will be referenced in the analysis drop down list and can be used to start a score automatically from the command line. In this sample, simply accept the default set name of My Analysis Set. Now the items that belong to this can be selected at any time in the future by picking My Analysis Set from the Select menu under Analysis Set found in the Configure menu.
[contents]
Report criteria definitions are managed in a single place. A single definition can be used in an unlimited number of reports. To begin modifying report criteria select Manage Criteria from the Configure menu.
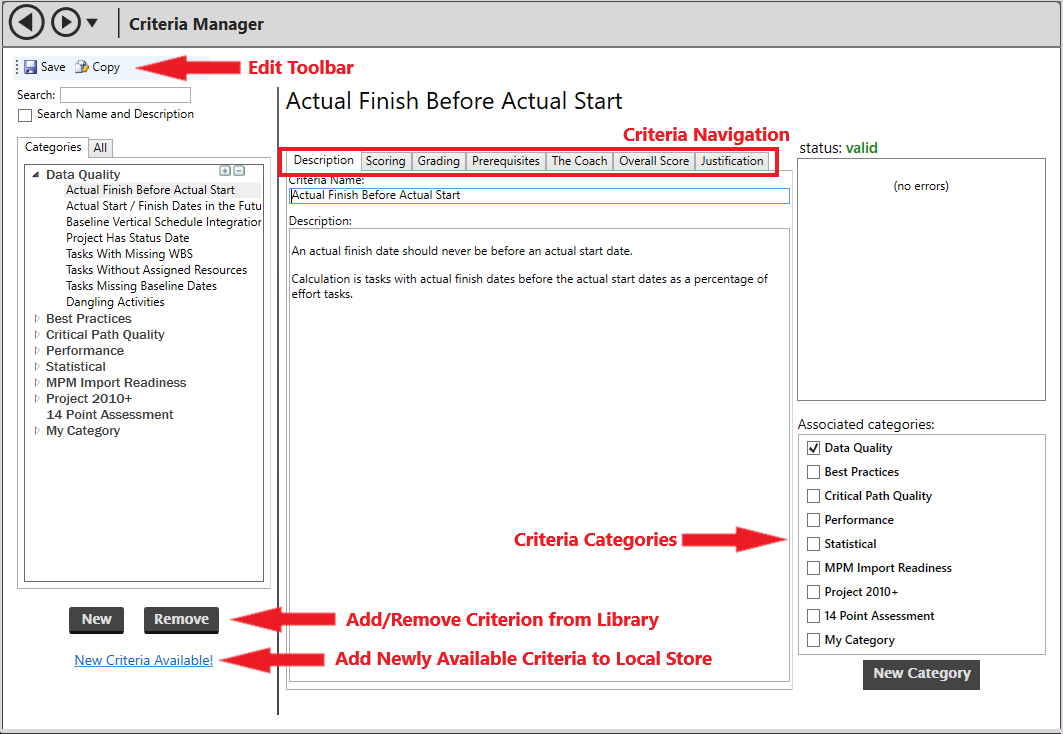
| Edit Toolbar | The Edit toolbar contains the buttons that allow you to save changes to a criterion and copy a criterion. |
| Criteria List | The criteria list displays a list of the criteria that have been loaded into the active criteria set. Select an individual criteria by clicking on its name in the criteria list. |
| Description Tab | Allows you to change the criterion's name and description. |
| Scoring Tab | There are two methods for scoring, and the scoring area allows you to select which method to use, as well as the specific filter or library criteria to use. |
| Grading Tab | You use the Grading Area to specify which side of the scale (lower, higher, or ideal value) is "better." |
| Prerequisites Tab | This section forces conditions within other criteria situations to be true before considering the score of this criteria valid. You may assign one or more prerequisite criteria to the criteria. |
| The Coach Tab | This section allows you to specify the help text the Coach will display for this criterion. |
| Overall Score Tab | This section allows you to assign overall score weights, when applicable. |
| Justification Tab | This section allows you to turn Justification on or off for the criterion, and specify Justification parameters. |
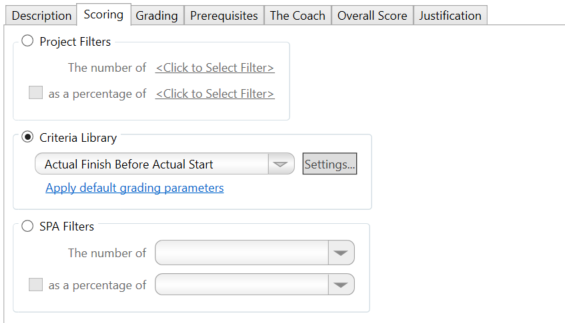
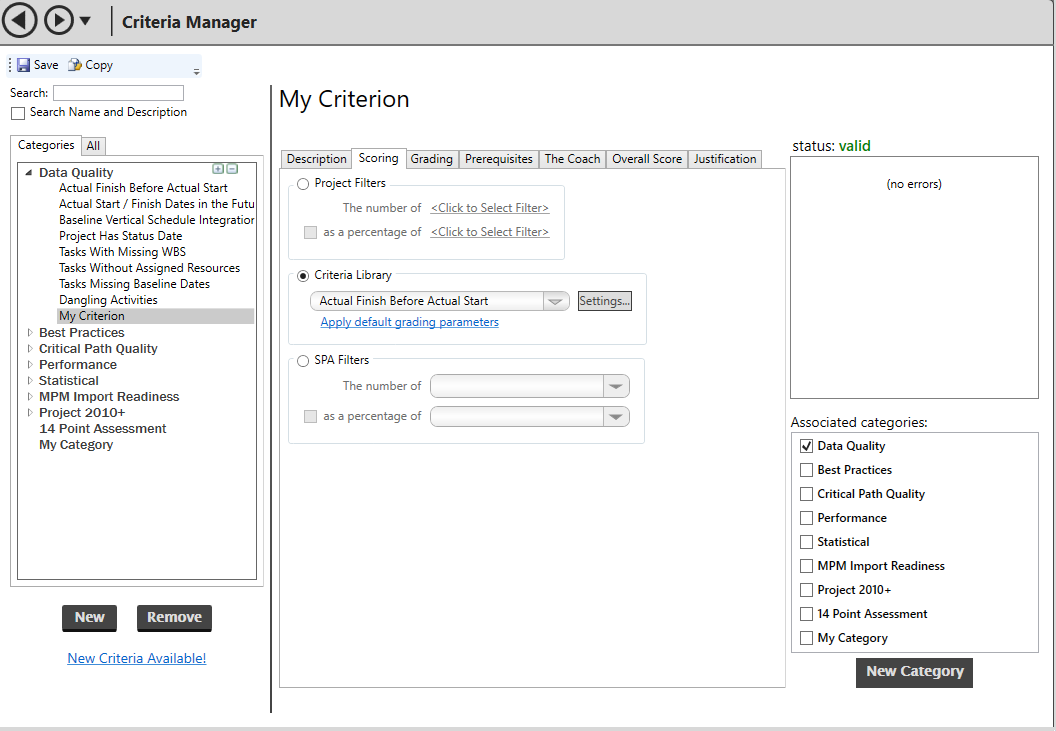
The Scoring Tab allows for either an SPA standard criterion, a filter within Microsoft Project, or an SPA filter to be selected as the source for scoring the tasks within the project. The three radio buttons allow you to specify the source. When the Project Filter is selected, Steelray Project Analyzer will automatically query Microsoft Project for its available filters. This list will be displayed when you click the filter link. If only one filter is selected, a count of all the tasks that match the filter will become the final score. If two filters are selected, the top filter's count becomes the numerator and the bottom filter's count becomes the denominator. The score is then the ratio of the two numbers represented as a percentage.
The same concept can be applied to filters that have been constructed in SPA. The SPA filters are internal to Project Analzyer, see the Using Filter Builder topic for more information regarding configuring SPA Filters.
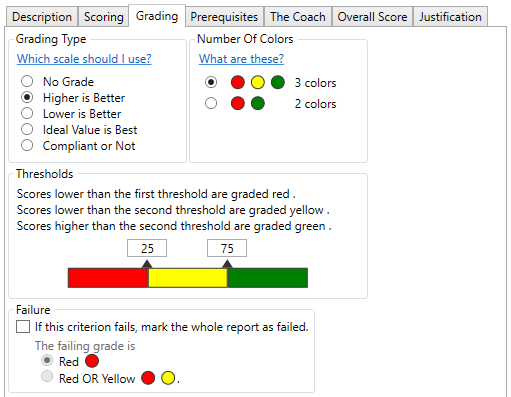
The grading tab presents a number of options related to how the scores are graded. The first group of options called Grading Type determine how the numbers relate to the colors. In most situations, green is considered positive or acceptable, yellow is acceptable but requires attention and red is negative or unacceptable.
Number of Colors
Number of Colors will tell the scoring module if two or three colors should be used when displaying the scale on the score card. This is applicable to all grading types except for the No Grade, which displays no color and the Compliant or Not scale which displays red or green only.
Thresholds
Thresholds tie score values together with colors on the scorecard. As options are selected, the way the color bars are drawn will change. In the sample above, the 3 color, lower is better scale is shown. The thresholds are 25 and 75. This indicates that the green begins at 0 and runs to 25. The red begins at 75 and runs to 100. In the 3 color configuration, this means that the yellow area is between 25 and 75. In a two color situation, there would be a single value to demark where green ends and red begins.
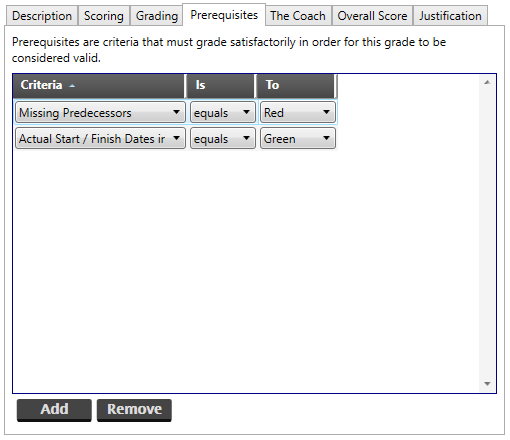
The prerequisites are a list of criteria that must obtain a certain score before the main scoring calculation can be considered valid. For example (shown above), the score for Delinquent Tasks may not be considered valid if Out of Sequence Tasks does not receive a green grade. All prerequisites must be satisfied before the score is considered valid.
To create a prerequisite, click the Add button below the Criteria list. Select fields for each of the three drop down lists. The left side is a criteria item, the middle drop down is an operator, and the right side is the score.
Everyone won't agree on how a project schedule should be graded. The power in Steelray Project Analyzer lies in the ability to customize the criteria to suit the needs of your organization.
Deleting a criteria is a two step process:
The fastest way to create new criteria is to use criteria built into the criteria library that ships with Project Analyzer.
Selecting the Scoring tab and clicking Criteria Library allows you to select pre-defined criteria. Click the New button and your new criteria is added to the bottom of the criteria list.
[contents]
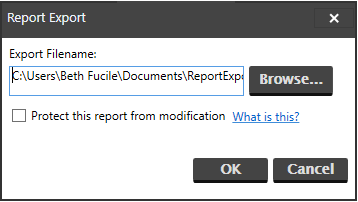
The filename and destination selected in this screen will contain all of the settings for the exported report(s).
A protected report will not add the criteria to the importer's criteria library and will not allow the importer to modify the report. The report is completely self-contained and the criteria and thresholds cannot be changed. This situation is desirable when a standard report with predetermined criteria and thresholds are agreed upon and should not be changed by those who are running this report. This can ensure a certain level of report fidelity.
Once the file is exported, it can be delivered to the recipients through normal file distribution means such as email attachments or network shares. When the end consumer receives the export file, they must select Import and then Report from the Report menu. When prompted, select the export file from the location it was saved. Upon a successful import, the imported report will appear in the Reports tree.
[contents]
Steelray ships with a number of criteria within our library with new criteria being added all the time. Couple this fact with the capability of adding custom criteria and filter based criteria and the task of locating the specific item you're looking for can become time-consuming. This is where criteria categories can help.
By default all of the criteria can be found on the All tab. All items, whether Steelray or user-created, can always be found by clicking on this tab. To view and manage your own criteria groups, open Criteria Manager and the list of criteria categories are located in the lower right corner. You can add new criteria categories (Add Category button), modify existing categories (click to rename), or remove categories (mouse-over and click blue X).
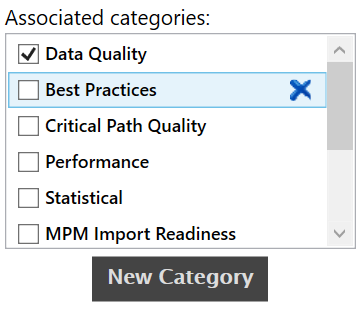
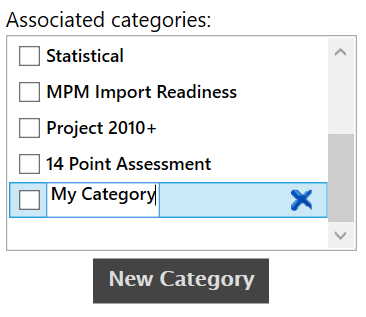
Once created, you can place a check mark next to the category name you'd like to associate this criterion with, as shown above. Renaming categories is as simple as double clicking the name. Once double clicked, the name is in edit mode as shown below. Type the new name of the category and hit [ENTER] to accept the new name or [ESC] to back out your change.
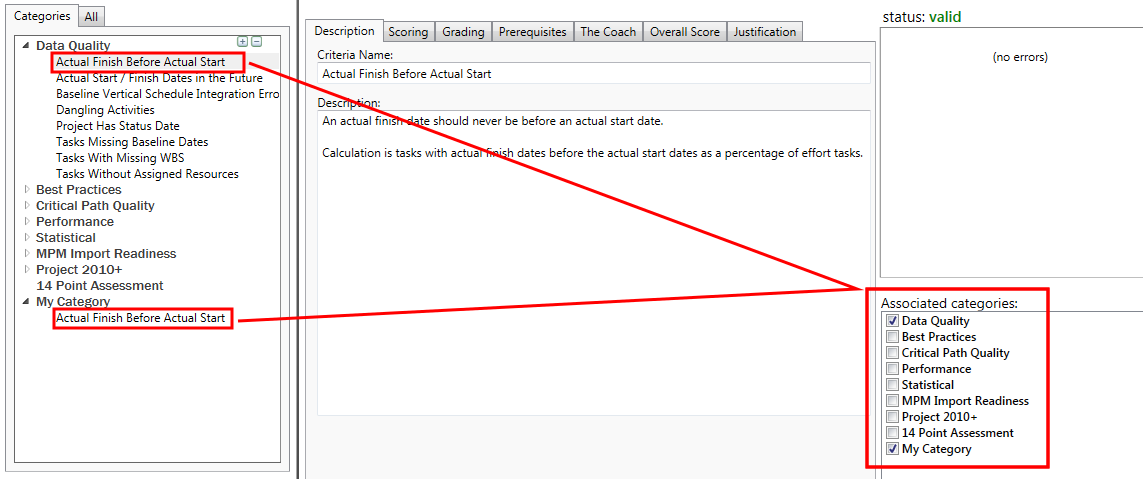
In the sample below, the criterion Actual Finish Before Actual Start is selected. Placing a checkbox next to My Category as shown now associates this criterion with the categories Data Quality and My Category.
The criteria categories are also equipped to perform fast inline searches. This functionality is designed to help you quickly locate criteria by name or description.
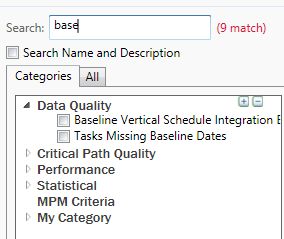
In the sample above, the text "base" was entered into the search field. This searched all available categories for any criteria that contained those letters. In this example we matched three criteria spanning two categories. There was a match in the Data Quality category for Baseline Vertical Schedule Integration and Tasks with Missing Baseline Dates. An additional match was found in the Performance category for Baseline Execution Index.
Place a check next to the Search Name and Description checkbox and the description will be searched and the criteria items that match will be shown.
[contents]
In a typical environment the field configuration tool will allow you to map user-defined fields. The field mapping will be stored on the local machine for easy redistribution among members within the organization. A field definition file that is marked as read-only cannot be modified by an end-user similar to Steelray Project Analyzer files in Project Analyzer.
The best way to look at the field mapping tool is as a global override. When Project Analyzer processes a score, it will look to see if the field is remapped via the mapping tool. If so, the mapped field will be used for scoring.
The field mapping tool is located in the Configure menu with Steelray Project Analyzer. Select the Field Mapper... option to invoke the screen below.
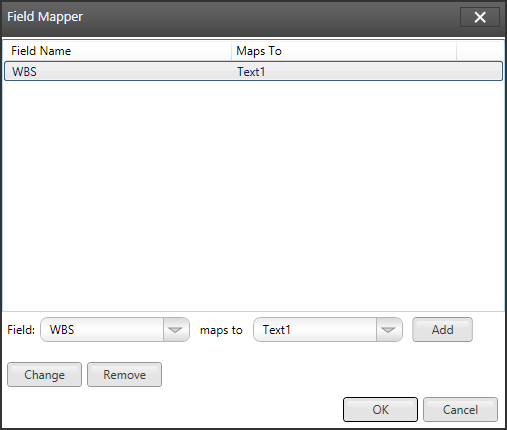
In the illustration above, the WBS field has been mapped to Text1. What this means is that any criteria that references WBS will automatically be forced to pull the value from Text1 within Project. As mentioned, this can be configured from machine to machine, so if another user defines Text2 as WBS, they may configure this on their machine.
To manipulate the mappings, use the Add, Change or Remove buttons. Each time an item is selected in the list, the Field Name, Provider and Mapping drop downs will change to reflect the selection. Clicking the Change button will modify the existing selection. Clicking the Add button will add a new mapping and clicking Remove will delete the current selection from the list.