The Gold Standard in Delay Analysis for Primavera P6
Steelray Delay Analyzer is breakthrough technology that can accurately identify and quantify the delays that impacted the finish date, including concurrent and but-for delays. It uses the Daily Progress Method to run a half-step analysis, per AACE RP 29R-03. It's no longer necessary to sift through long lists of changes to try to figure out which ones impacted the finish date. Delay Analyzer provides the answers in seconds.
Delay Analyzer is the choice of the industry experts, the professionals who are paid to conduct delay analyses and serve as expert witnesses in claims disputes.


Schedule Analysis + Computer Science
Delay Analyzer has super-fast highly optimized engines for schedule comparison, forensic delay analysis, and critical path analysis. Those engines allow you to perform analyses that were previously not possible in real time. It will save you days each month while providing you with an objective, accurate and complete explanation of why the finish date (or any activity or milestone) moved between updates.
Boost Productivity
Before Delay Analyzer, performing a true delay analysis involved hours or days running a detailed comparison of two updates, applying each change independently, observing the impact on the finish date, and recording the results.
Objective Analysis
Delay Analyzer compares updates of the schedule over time and applies each change over the period while observing the impact on the finish date. The analysis is objective and follows AACE recommended practices for delay analysis.
Better Visualizations
Your results are reported in simple-to-understand visualizations that enable you to explain what happened in real time. You can drag the data date and watch our Gantt Chart update in real time to better understand delays and recoveries.
Built from Scratch for Delay Analysis
- A fully-automated half-step analysis, following the methodology from AACE RP 29R-03, MIP 3.4, is conducted on any number of project update XER exports within seconds. The half-step analysis works by identifying all changes between each successive update and applying the progress-related changes to the schedule at the start of the period. The impact to the finish date (delays and recoveries) from each change is recorded. At the end of the period, the schedule revisions are applied and their impact of those revisions is recorded.
- Concurrent delays, e.g. delays that happen simultaneously, are calculated and visible in reports and the Gantt chart.
- Export a progress-only schedule and critical path.
- Generation of a contemporaneous critical path for each analysis window.
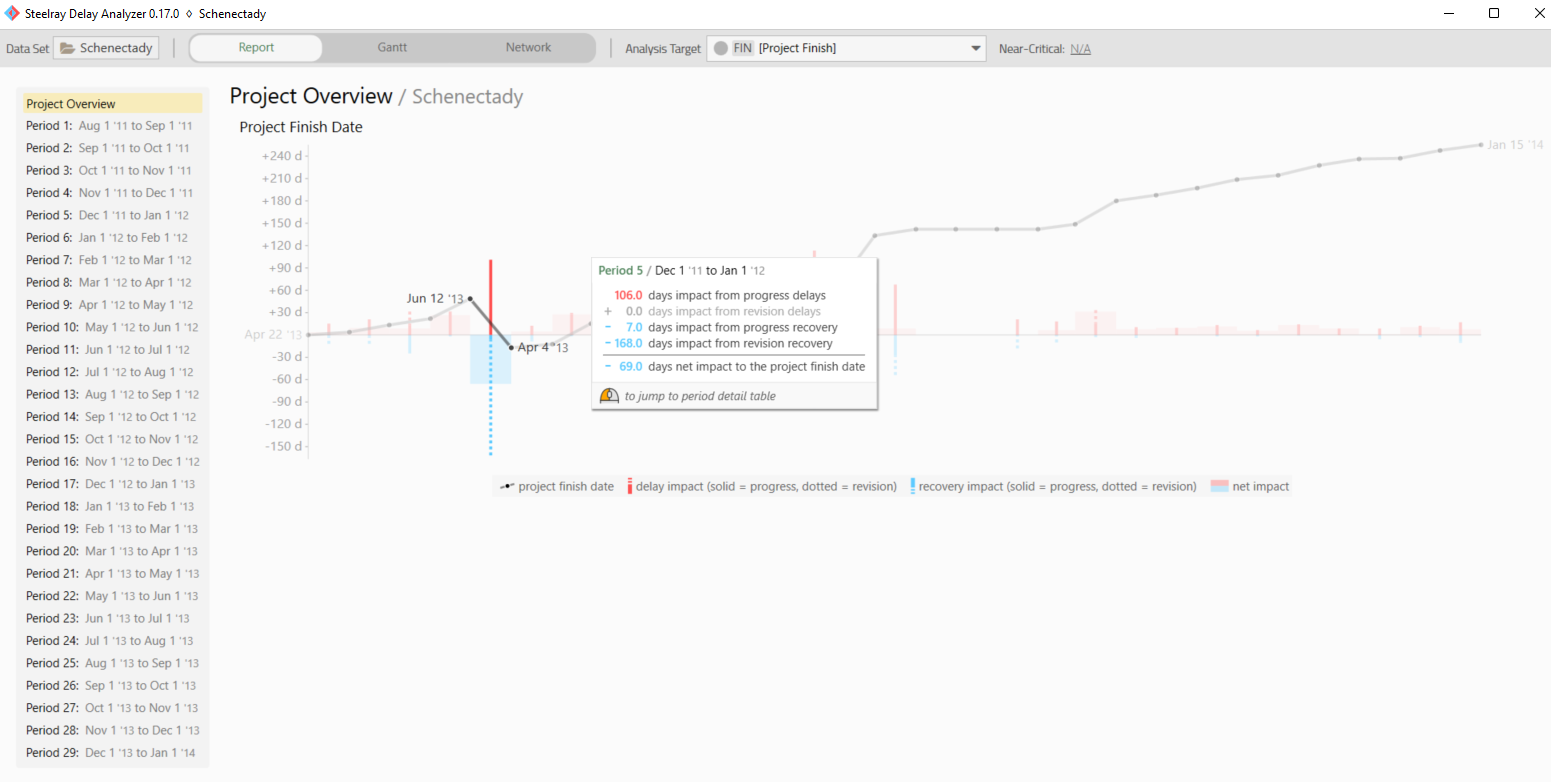
- An Overview Report summarizes the half-step analysis, showing the total delays and accelerations in each comparison period over time, split by progress-related changes and schedule revisions.
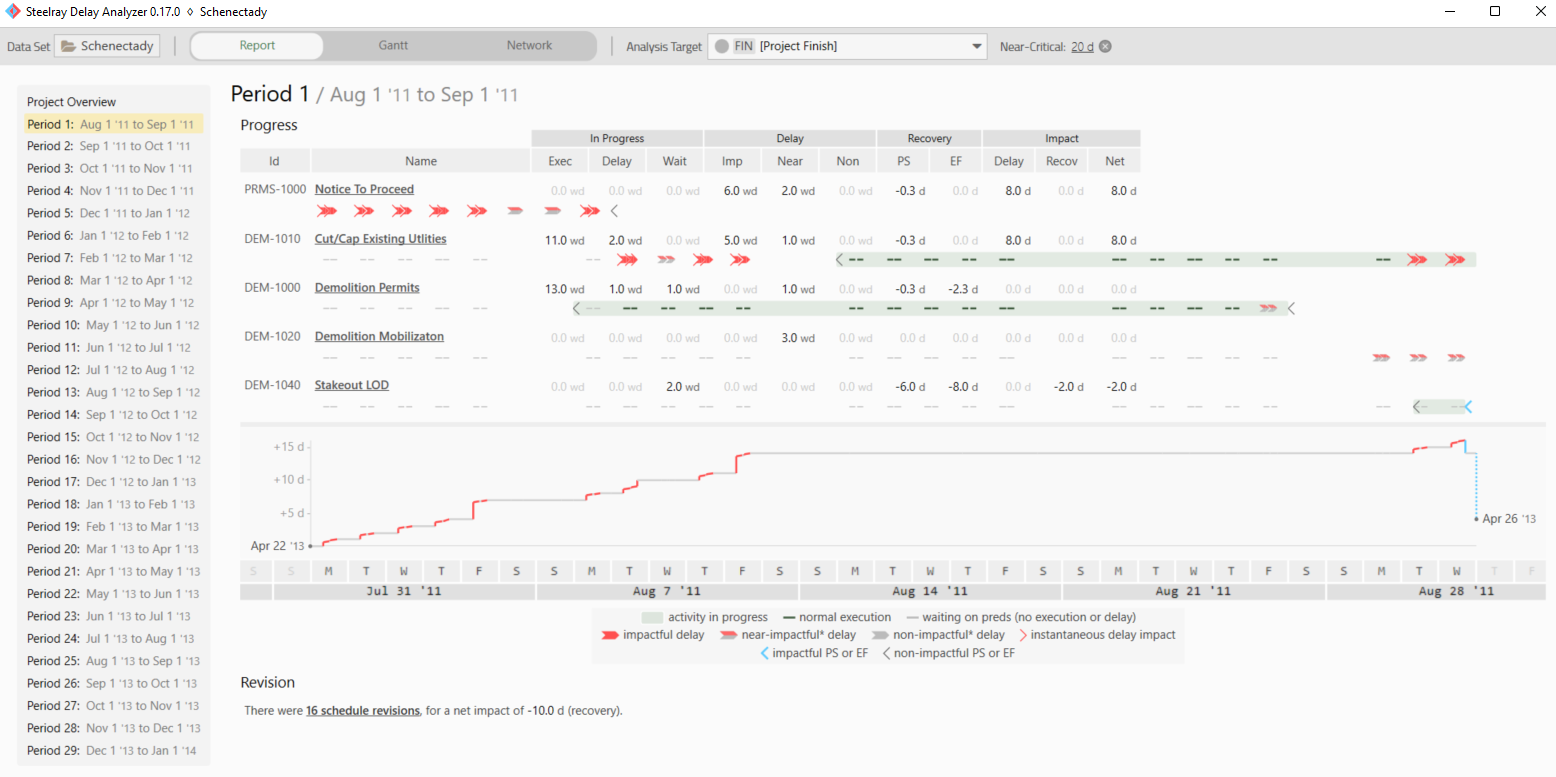
- Period Detail Reports show exactly which activities caused an impact to the finish date because of progress-related changes like early/late starts/finishes and out-of-sequence execution. A graph maps the impact day by day over the period.
- Schedule revision summaries show changes to logic, remaining duration, calendars, added/removed activities, etc. Float before and after the change is displayed to help determine whether the change had an impact on the finish date.
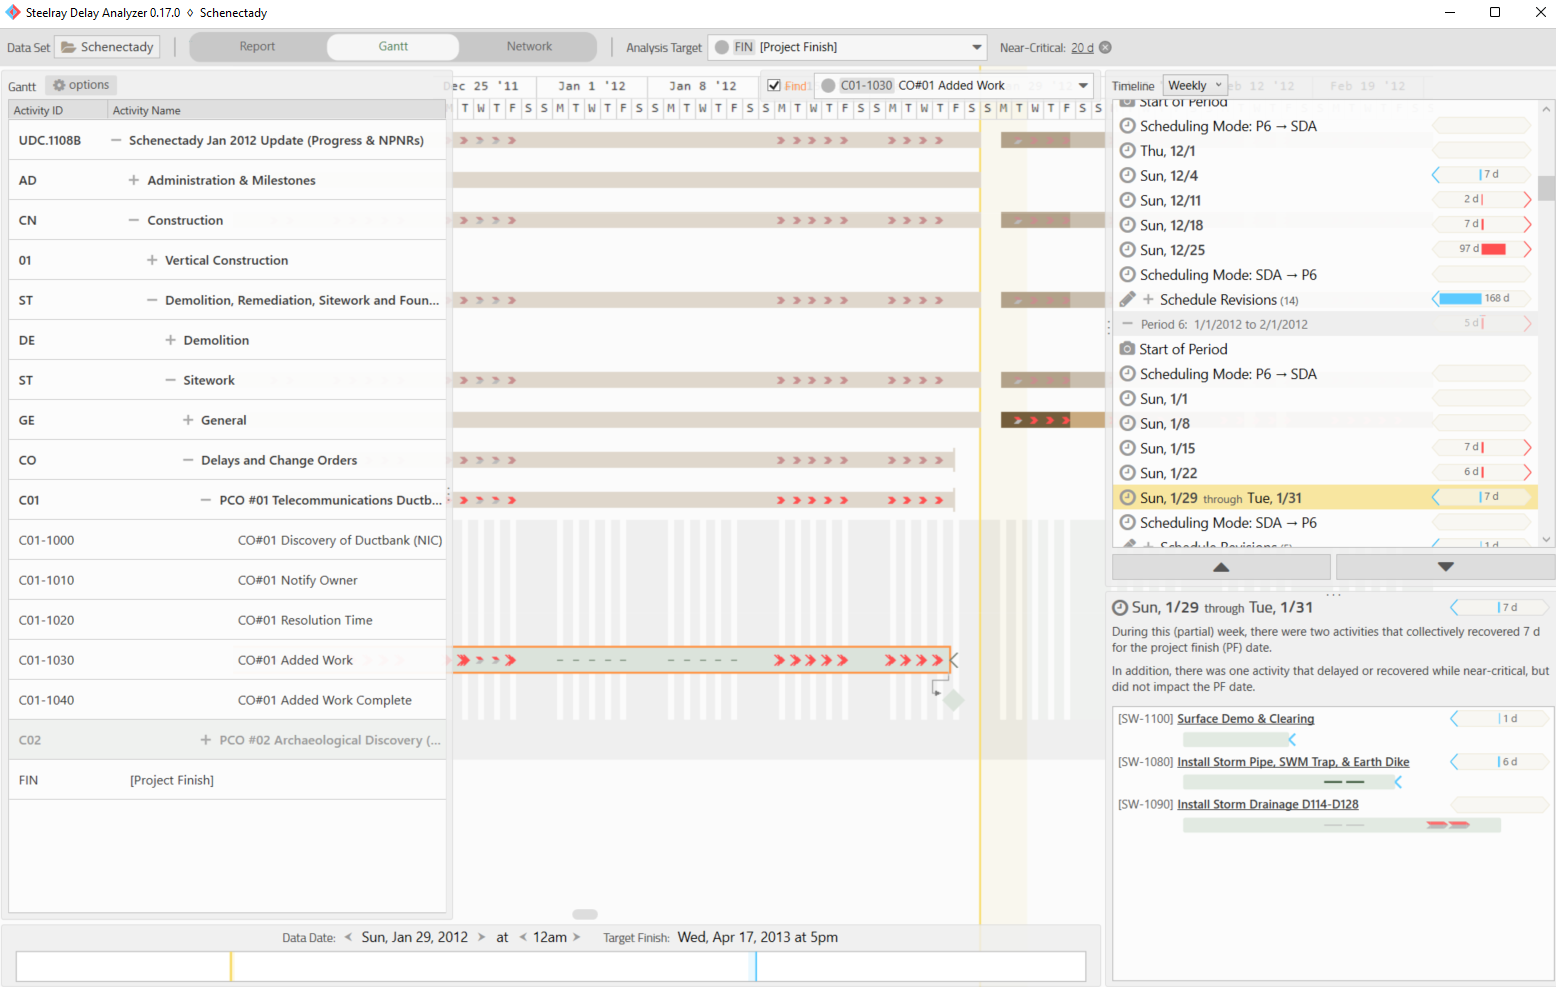
- A 3D Gantt where you can drag the data date forward and back through time (as detailed as hour by hour) and see the Gantt change in real time. The Gantt also includes:
- Delay Overlays which map delays and accelerations onto the WBS and activity bars.
- Filter the Gantt by longest path, critical, or progress status, including grouping and sorting options.
- A delay analysis Timeline View which breaks down the delays by day, by week, or by period. This supports our design principle to be transparent.
- Selectable Analysis Targets allow you to analyze to any activity or milestone in the schedule or simply the project's finish.
- A Microsoft Excel Report that you can export. The Excel sheet has a tab for the Overview Report (see above) and 2 tabs for each comparison period in the analysis:
- A Period Detail Report (see above)
- A Longest Path Change Analysis, which shows precisely how the longest path changed over the period.
- Near-Critical Analysis is supported by setting a near critical threshold in the application. The threshold represents the maximum number of hours of float an activity must have to be deemed near-critical.
- A Network Diagram shows the entire schedule as a graph, with custom color filters and annotations showing delays.
Our Training is Better Than Free
Our videos (and cheat sheet) are free, but because of the time you'll save by watching them, we're basically giving you money.
steelray.tv is our training channel on YouTube.

Request a Demo
Fill out the form below to request a demo of Delay Analyzer.
Once we receive your information, we'll be in touch.
Purchase a Delay Analyzer Subscription
For pricing and licensing questions, please contact Steelray Sales.
Annual Subscription
- unlimited projects
- includes tech support
- includes all updates
Monthly Subscription
- unlimited projects
- includes tech support
- includes all updates