
Table of Contents
This tutorial provides an in depth look at our scorecard features and how you can utilize them to produce a higher quality schedule. For a quick tutorial of how to generate a scorecard, please visit the Scorecard in 3 Quick Steps Tutorial.
Let's briefly walk through the scorecard components. Each number below represents a component on the scorecard.
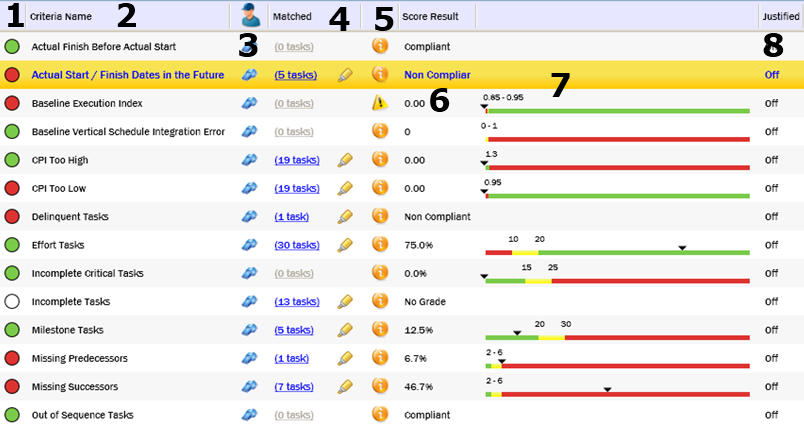
At a glance, it is obvious if a score for this particular criterion is a pass or fail. A red indicator is a failing grade, green is a passing grade and yellow, if applicable, is a grade that needs further examination.
The criteria name is a user defined name given to this item. It encompasses the calculation, thresholds for grading and scoring result.
Click the whistle for any criterion on the scorecard and receive detailed help that includes the calculation, what fields are included in the calculation and tips for how to fix tasks that were flagged in this calculation.
The Missing Successors criterion shows that there are 7 tasks that match this criterion. Upon clicking the hyperlink that reads "7 Tasks", the project is loaded (if it hasn’t been previously loaded) and Project Analyzer will direct Microsoft Project to display only the 7 tasks that match. Clicking the Highlighter immediately to the right of the hyperlink will highlight the tasks within Project rather than filter so that you may see those tasks within the context of the rest of the schedule.
Some criteria communicate information beyond the calculation. For example, the Project Has a Status date criterion may want to tell you what the status date is. The Information graphic appears when there is additional information and clicking it will display that information.
These contain the final score for the criteria. Based on whether this criteria was set up as percentage, raw value or compliant/non-compliant dictates the way this information is displayed.
Where the traffic signals give you a terse look at the result, the threshold bar puts things into perspective. The black triangle points to the actual result value. You might ask "how green am I?" and you can determine if something is far into it's reported color or close to the border with another color.
If justification is enabled and criteria has encountered tasks that encounter the justification parameters, a hyperlink will give you a count of jusitified along with a filtering mechanism so that you may drill down in Microsoft Project to see the justified tasks.